Clustering and Cell Type Annotation Analyses on Bone Marrow Organoids dataset
In this case study, we perform clustering and cell type annotation on a dataset of bone marrow organoids (BMO) generated from human induced pluripotent stem cells.
You can import the study in this tutorial with view-permission to your study list using the following link:
https://cytoanalyst.tinnguyen-lab.com/studies/import/hvjw7ifjDWqSHvkAG
Dataset
We collected the bone marrow organoids dataset for this analysis from the CZ CELLxGENE database. Below is the dataset information:
Dataset download link: here
Collection: Generation of complex human induced pluripotent stem cell-derived bone marrow organoids
Publication: Generation of complex bone marrow organoids from human induced pluripotent stem cells

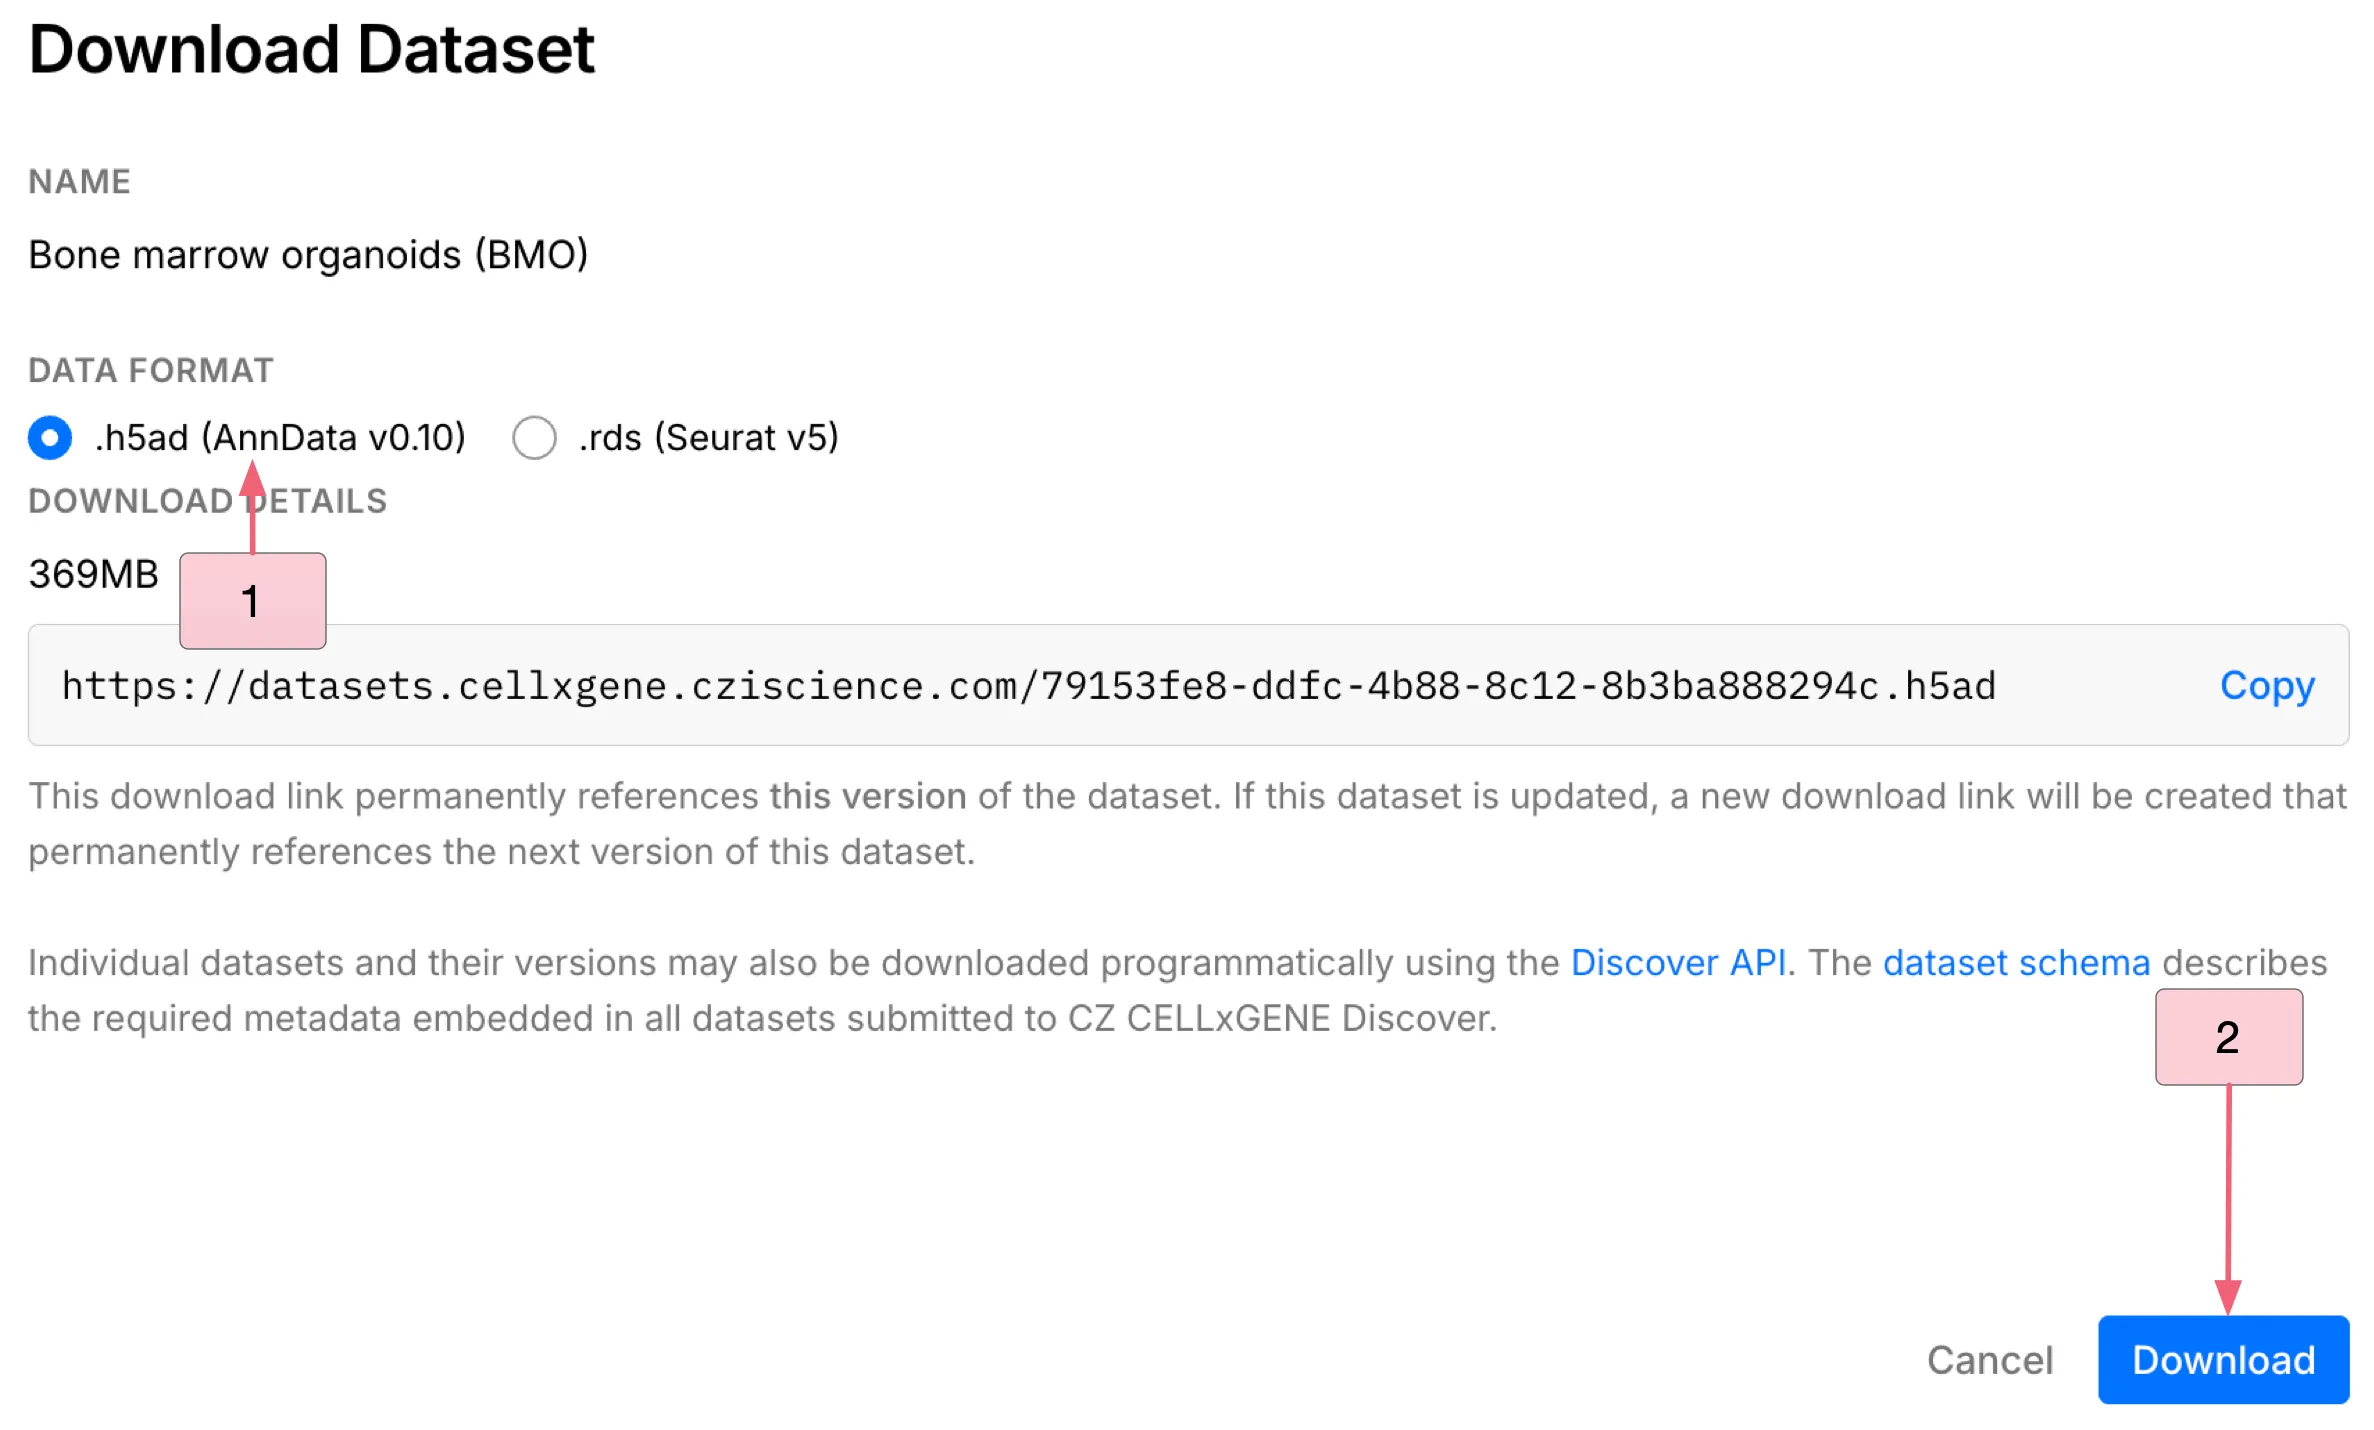
To download the dataset, follow these steps:
Click the
Downloadbutton to open the download dialog.Under the
DATA FORMAT, choose the.h5ad (AnnData v0.10)file format.Click the
Downloadbutton at the bottom to download the dataset.
Workflow
Create a New Study
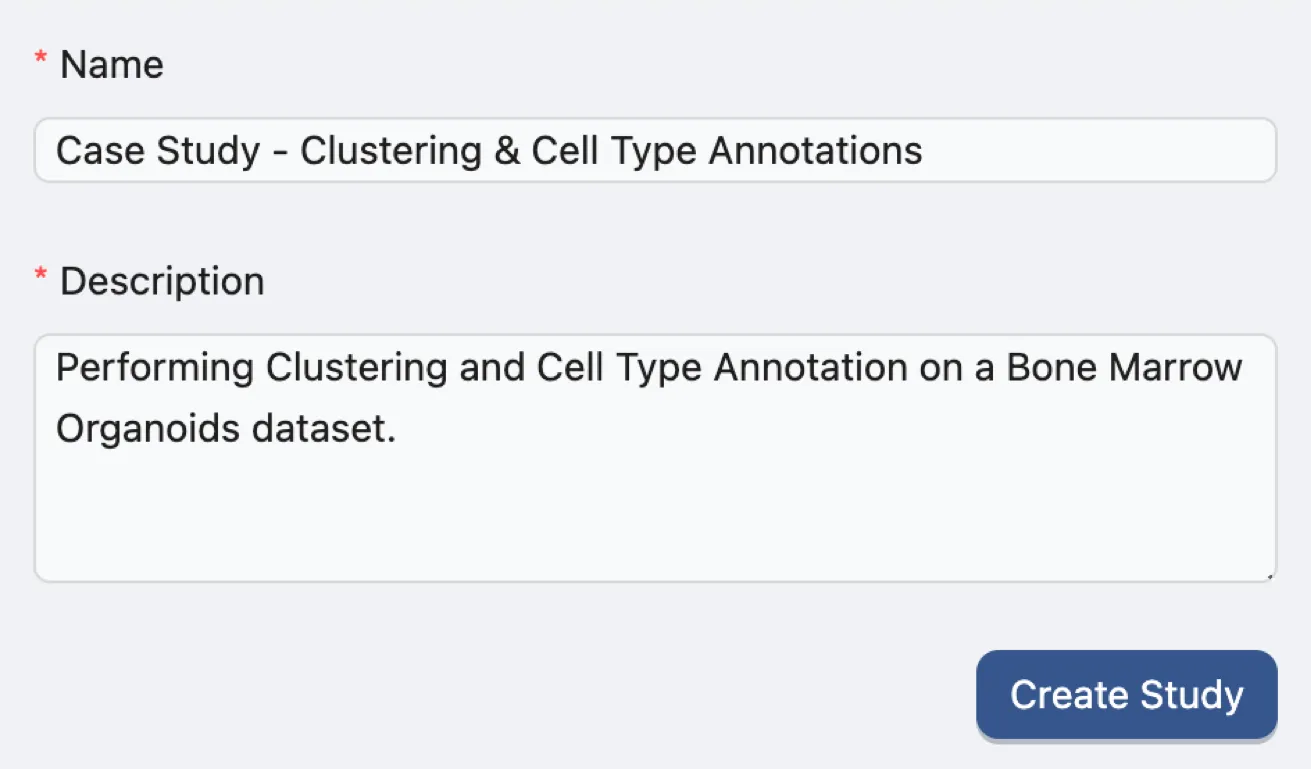
To create a new study, navigate to the Study Management page and fill in the required fields in the Create Study form with following the inputs:
Name:
Case Study - Clustering & Cell Type Annotation. A descriptive name for the case study.Description:
Performing Clustering and Cell Type Annotation on a Bone Marrow Organoids dataset. A brief description of the case study.
Click the Create Study button to generate the new study.
Once the study is created, you will be redirected to the Data page of the new study.
Note: To modify the study name or description, click the Studies button in the Study navigation bar located at the top of the page. For additional information about managing studies, please refer to the Study Management page.

Upload Data
Uploading and Processing the data
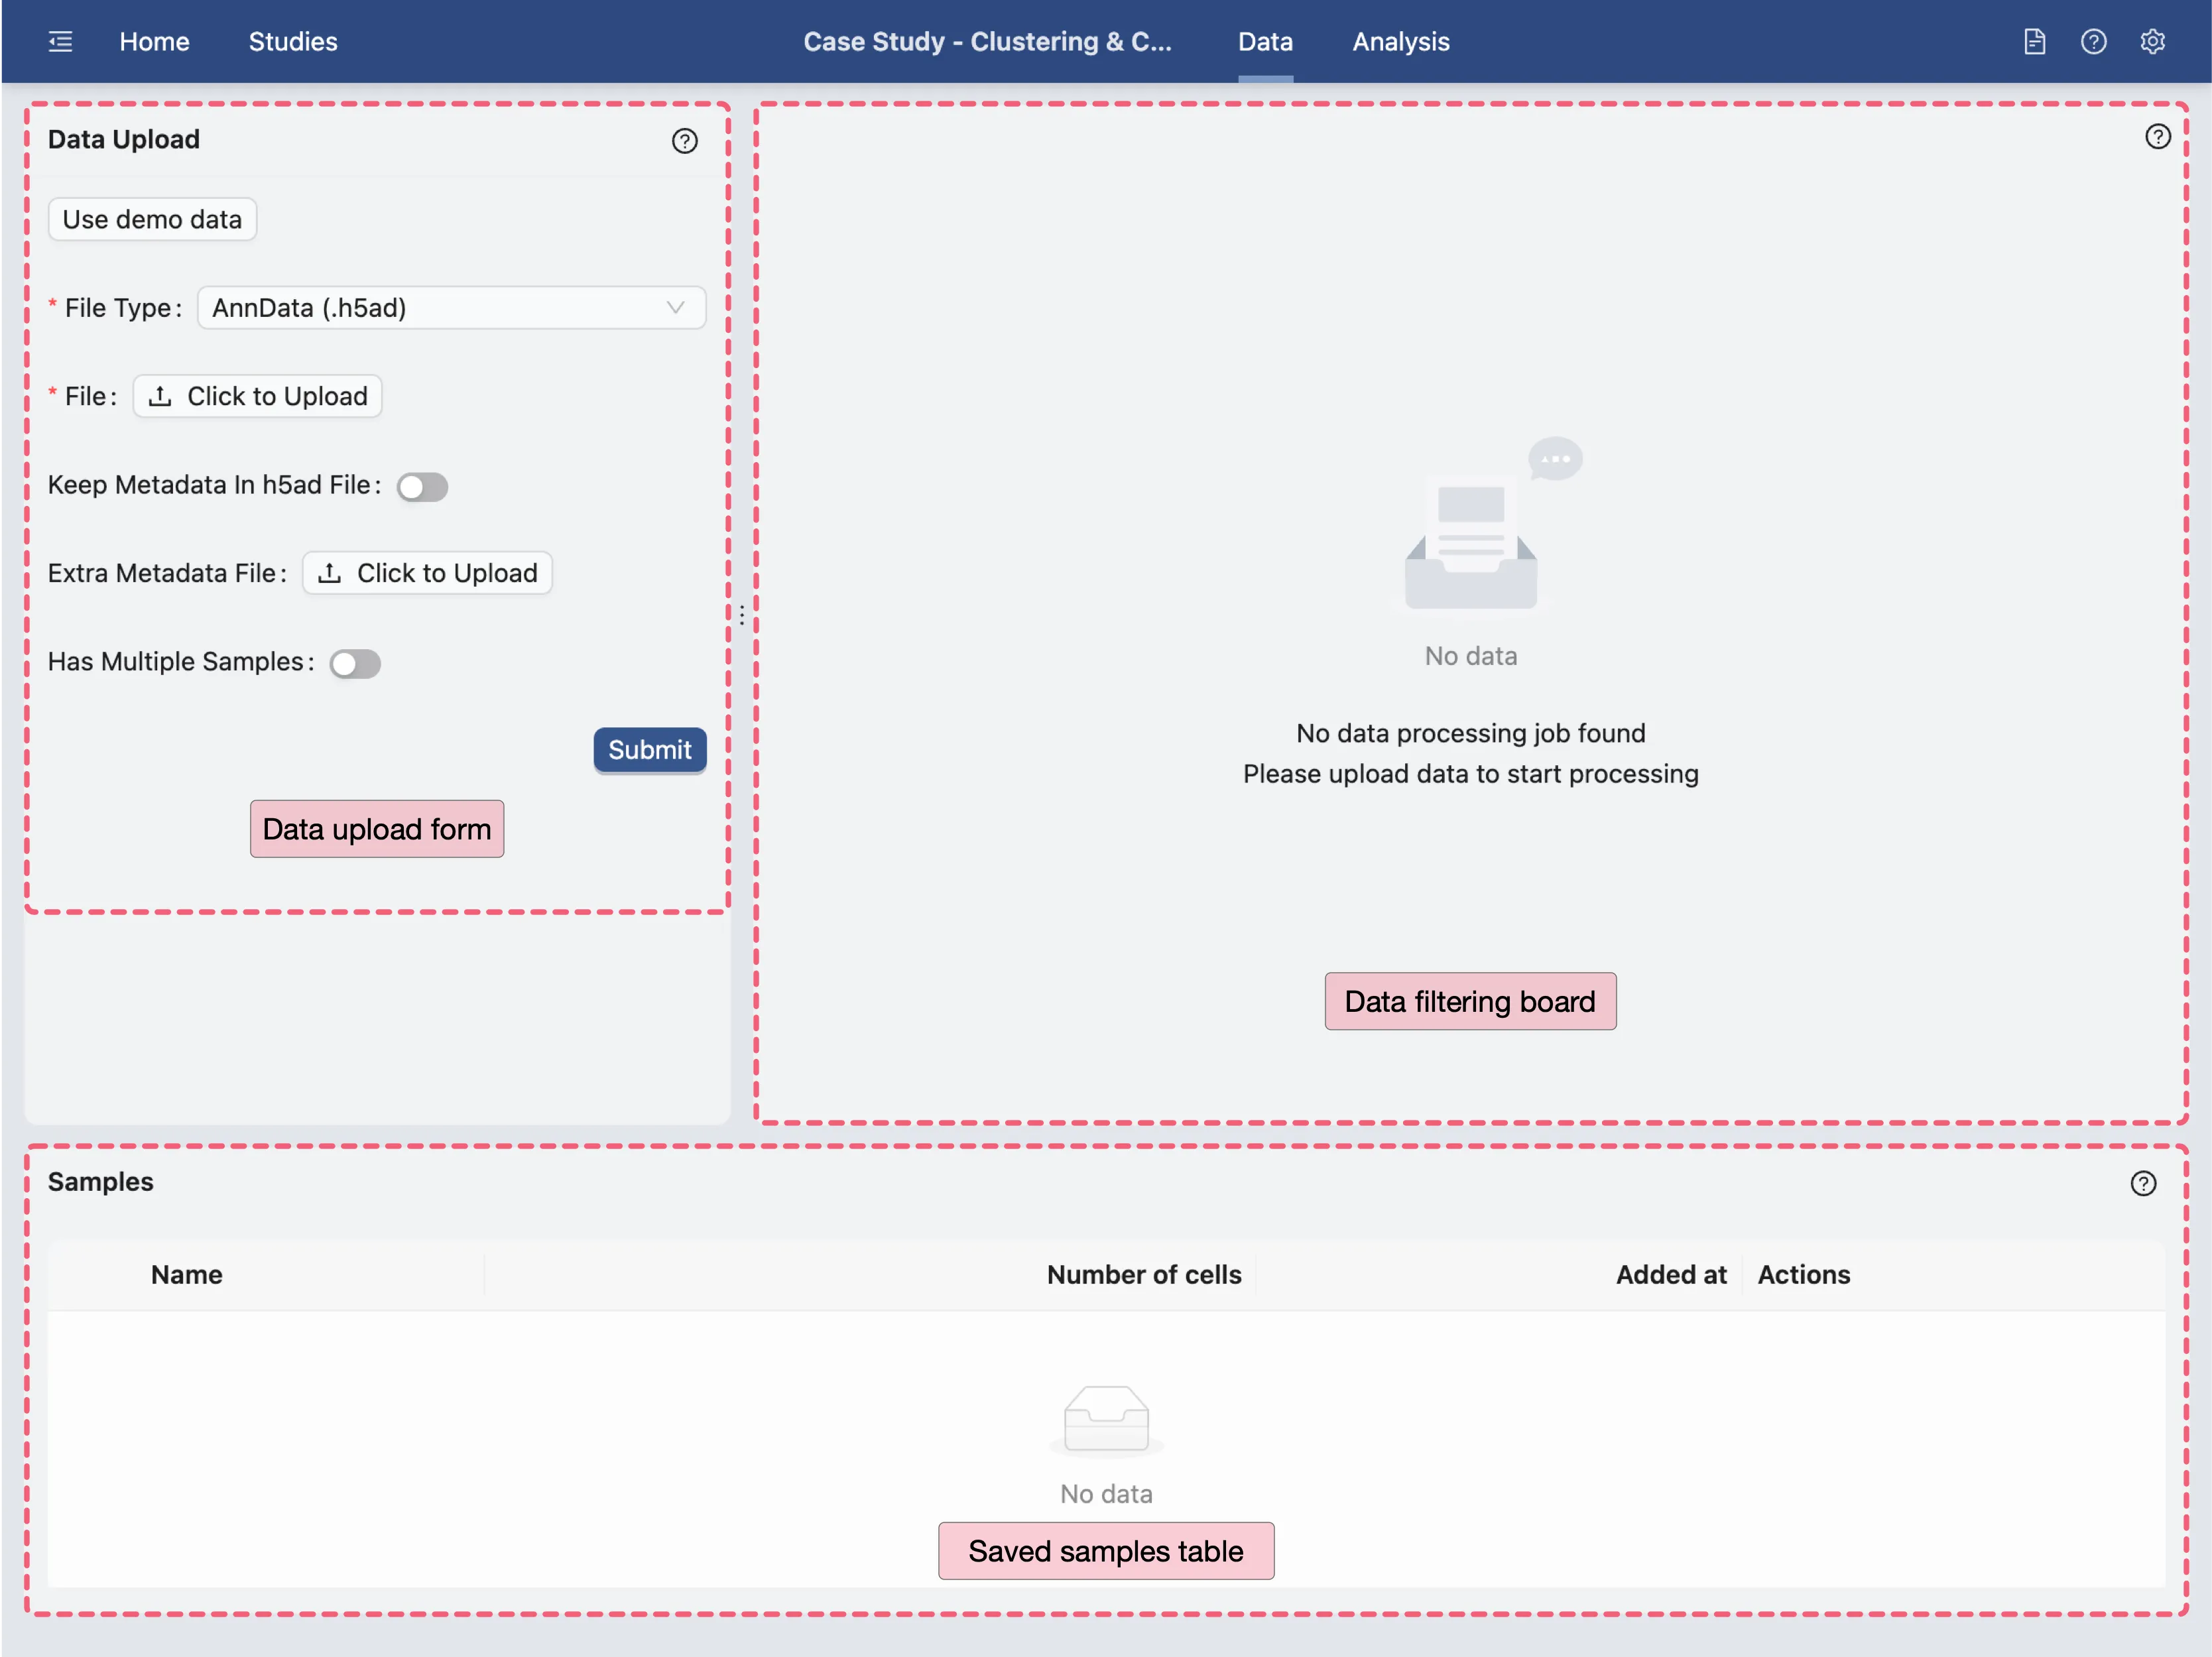
On the data management page, we will upload the downloaded dataset. Click the Click to upload button and select the downloaded dataset to upload.
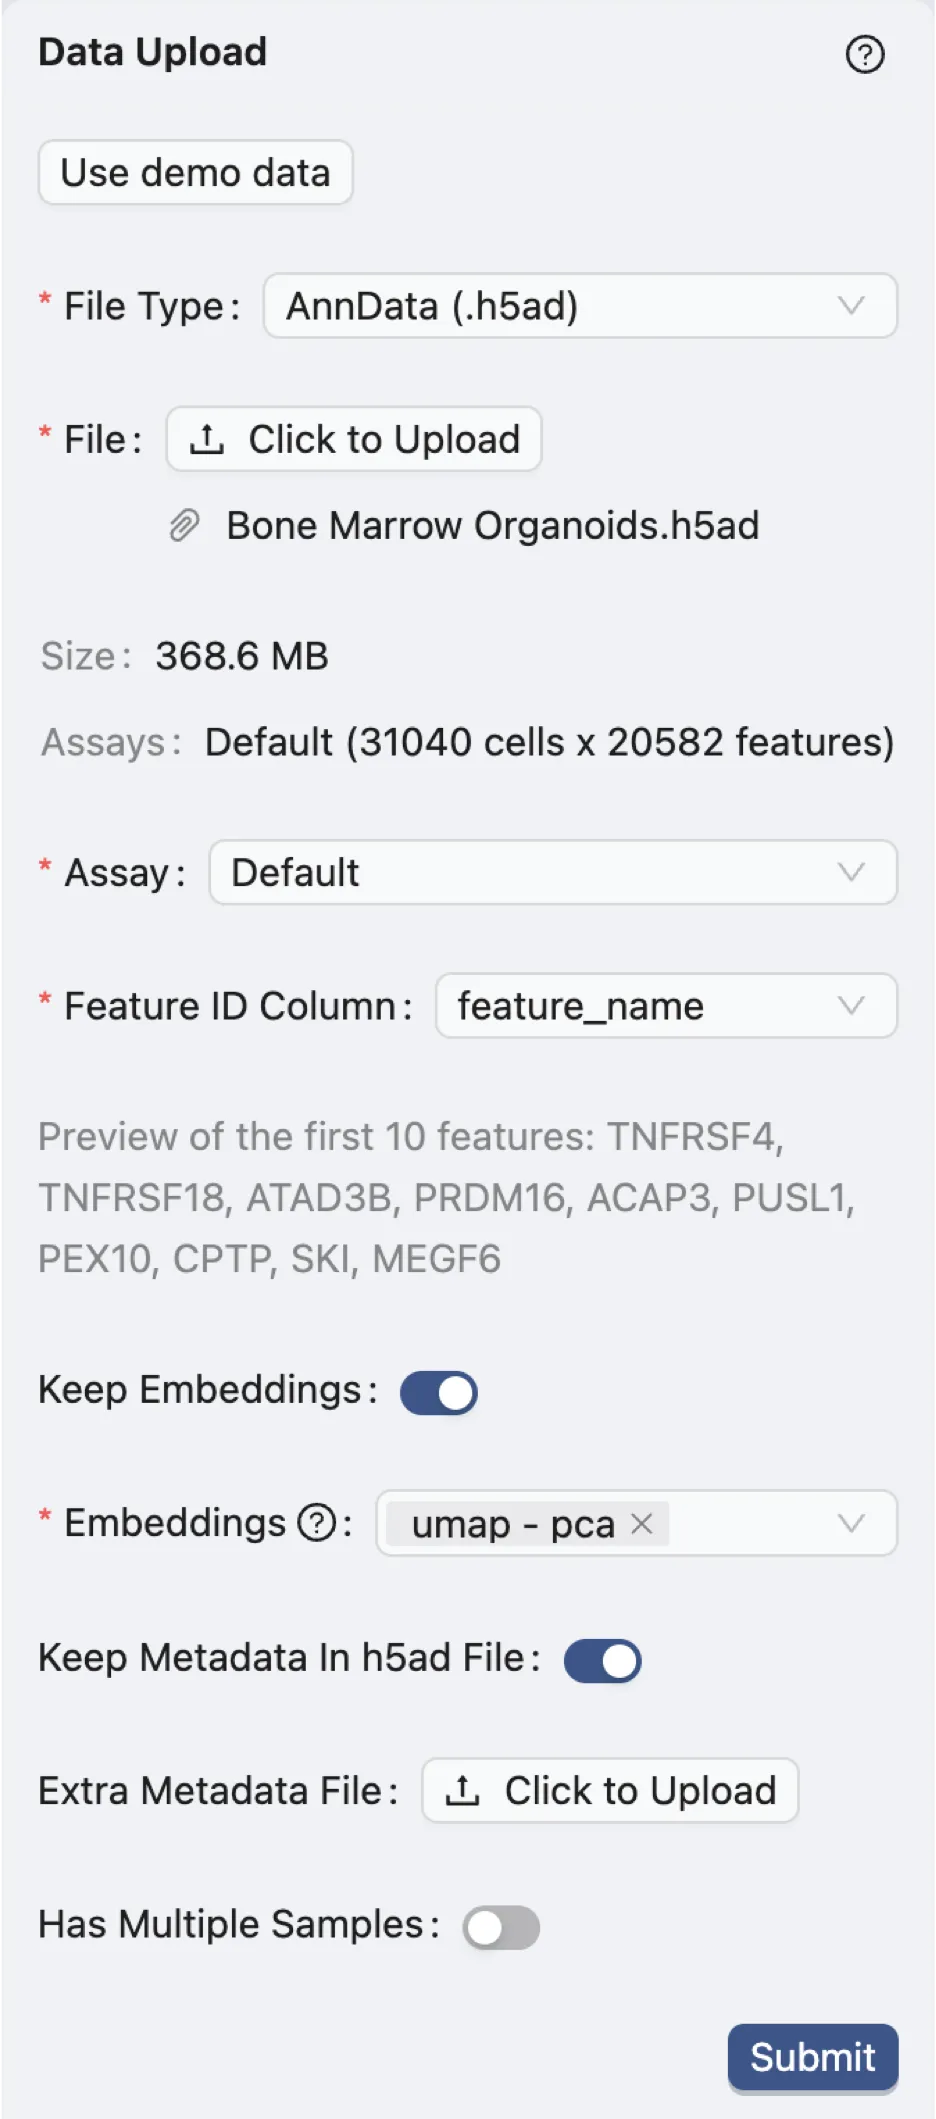
File Type:
AnnData (.h5ad). Specifies the file format of the dataset.Assay:
Default. Indicates the type of assay used in the dataset. In this case, it is the default assay.Feature ID Column:
feature_name. Identifies the column in the dataset that contains the feature IDs, which are the gene names in this case.Keep Embeddings:
True. Indicates whether to retain the precomputed embeddings in the dataset.Embeddings:
umap - pca. Specifies precomputed visualizations and embeddings to be kept.Keep Metadata in h5ad File:
True. Indicates whether to retain the metadata within the dataset file.Extra Metadata File:
Empty. Specifies an additional metadata file to be uploaded. In this case, no extra metadata file is provided.Has Multiple Samples
False. Indicates whether the dataset contains multiple samples. In this case, there is only one sample in the dataset.
Click the Submit button to start the data processing.
A job will be created in the background to process the data. Once the job is complete, the right panel will display options for data filtering. Visit Study Logs to learn more about monitoring analysis jobs and system status.
Data Filtering
Once the data processing is complete, the filtering options will appear in the Data Filtering panel.
Note:: The authors have already excluded barcodes with fewer than 400 detected genes, more than 40,000 counts in total, or mitochondrial genes exeeding 10% of the total gene counts. Refer to the publication for further details about the filtering process.
Therefore, no further filtering will be applied to the dataset.
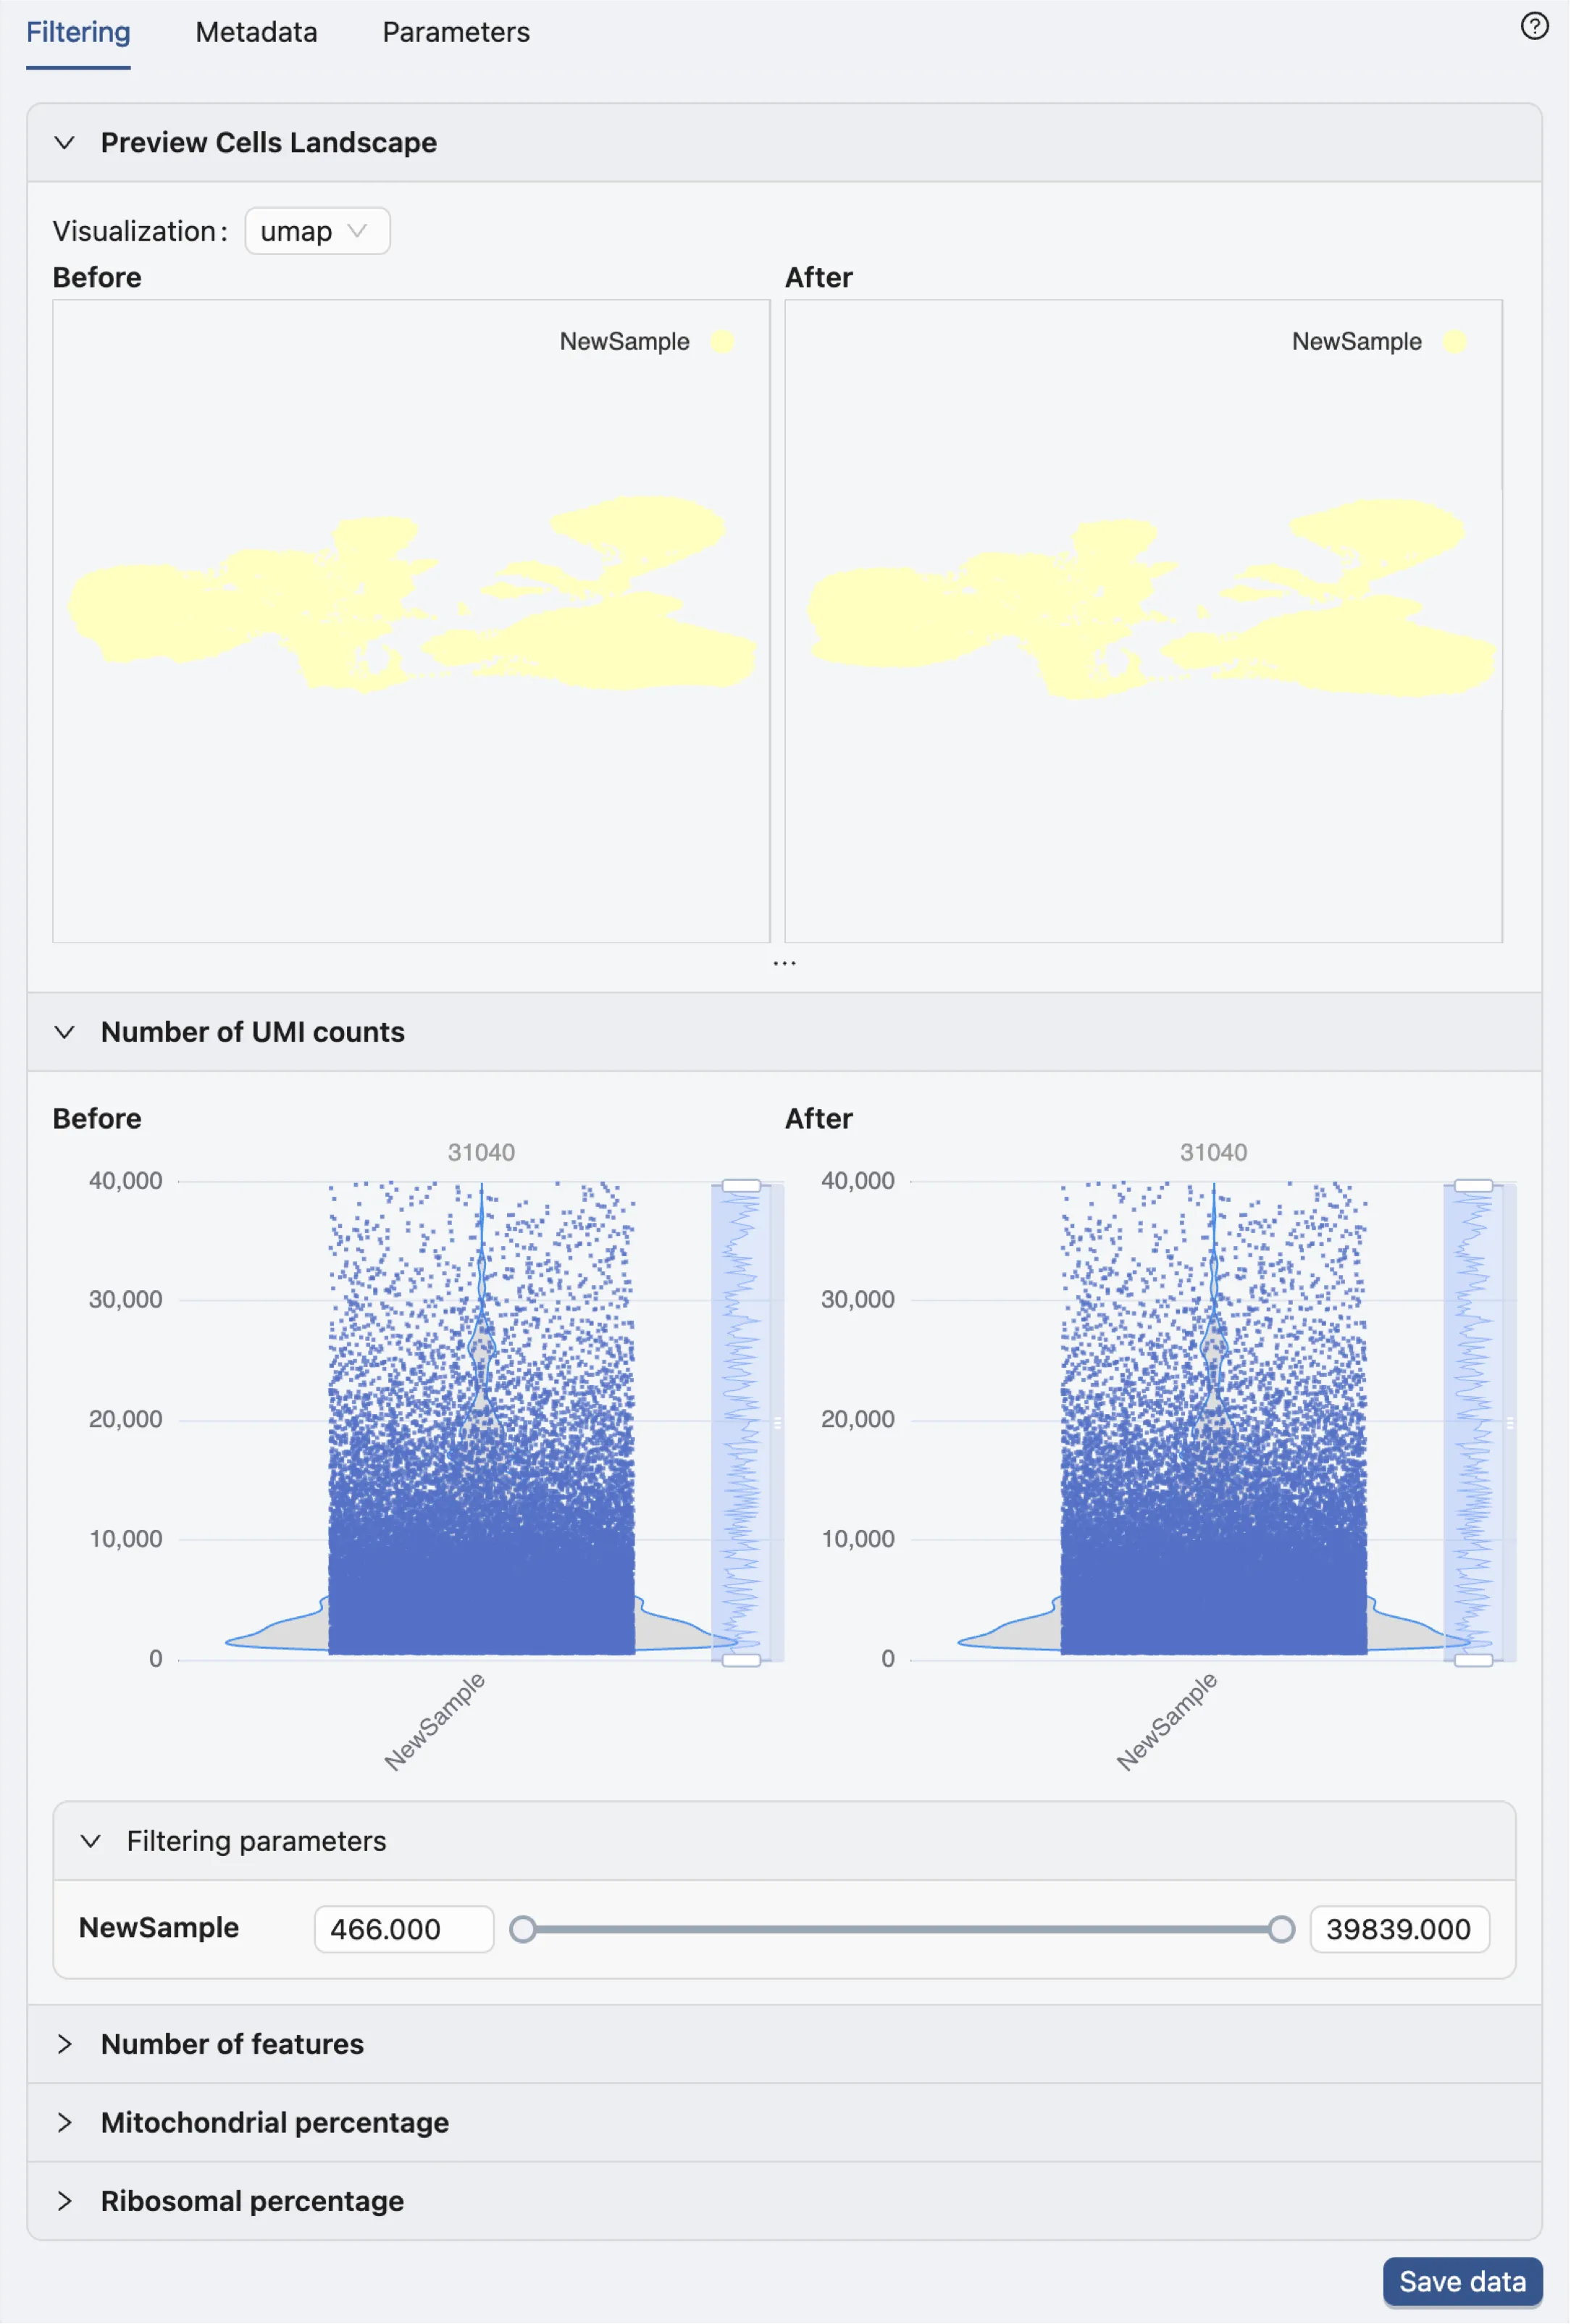
Save data
Click the Save data button in the Data Filtering panel to open the dialog for saving data.

This dialog enables you to choose which samples and embeddings to save.
By default, the sample name is NewSample. To rename it, click the Edit button next to the NewSample and change it to Bone Marrow.
Finally, click the Save data button to save your selection. The newly saved data will then appear in the data table.

Navigate to the Analysis page.
Once the data is saved, click the Analysis button in the Study navigation bar at the top of the page to navigate to the Analysis page.
The Analysis page provides a comprehensive view of the data and analysis tools. The basic layout of the Analysis page is shown below:
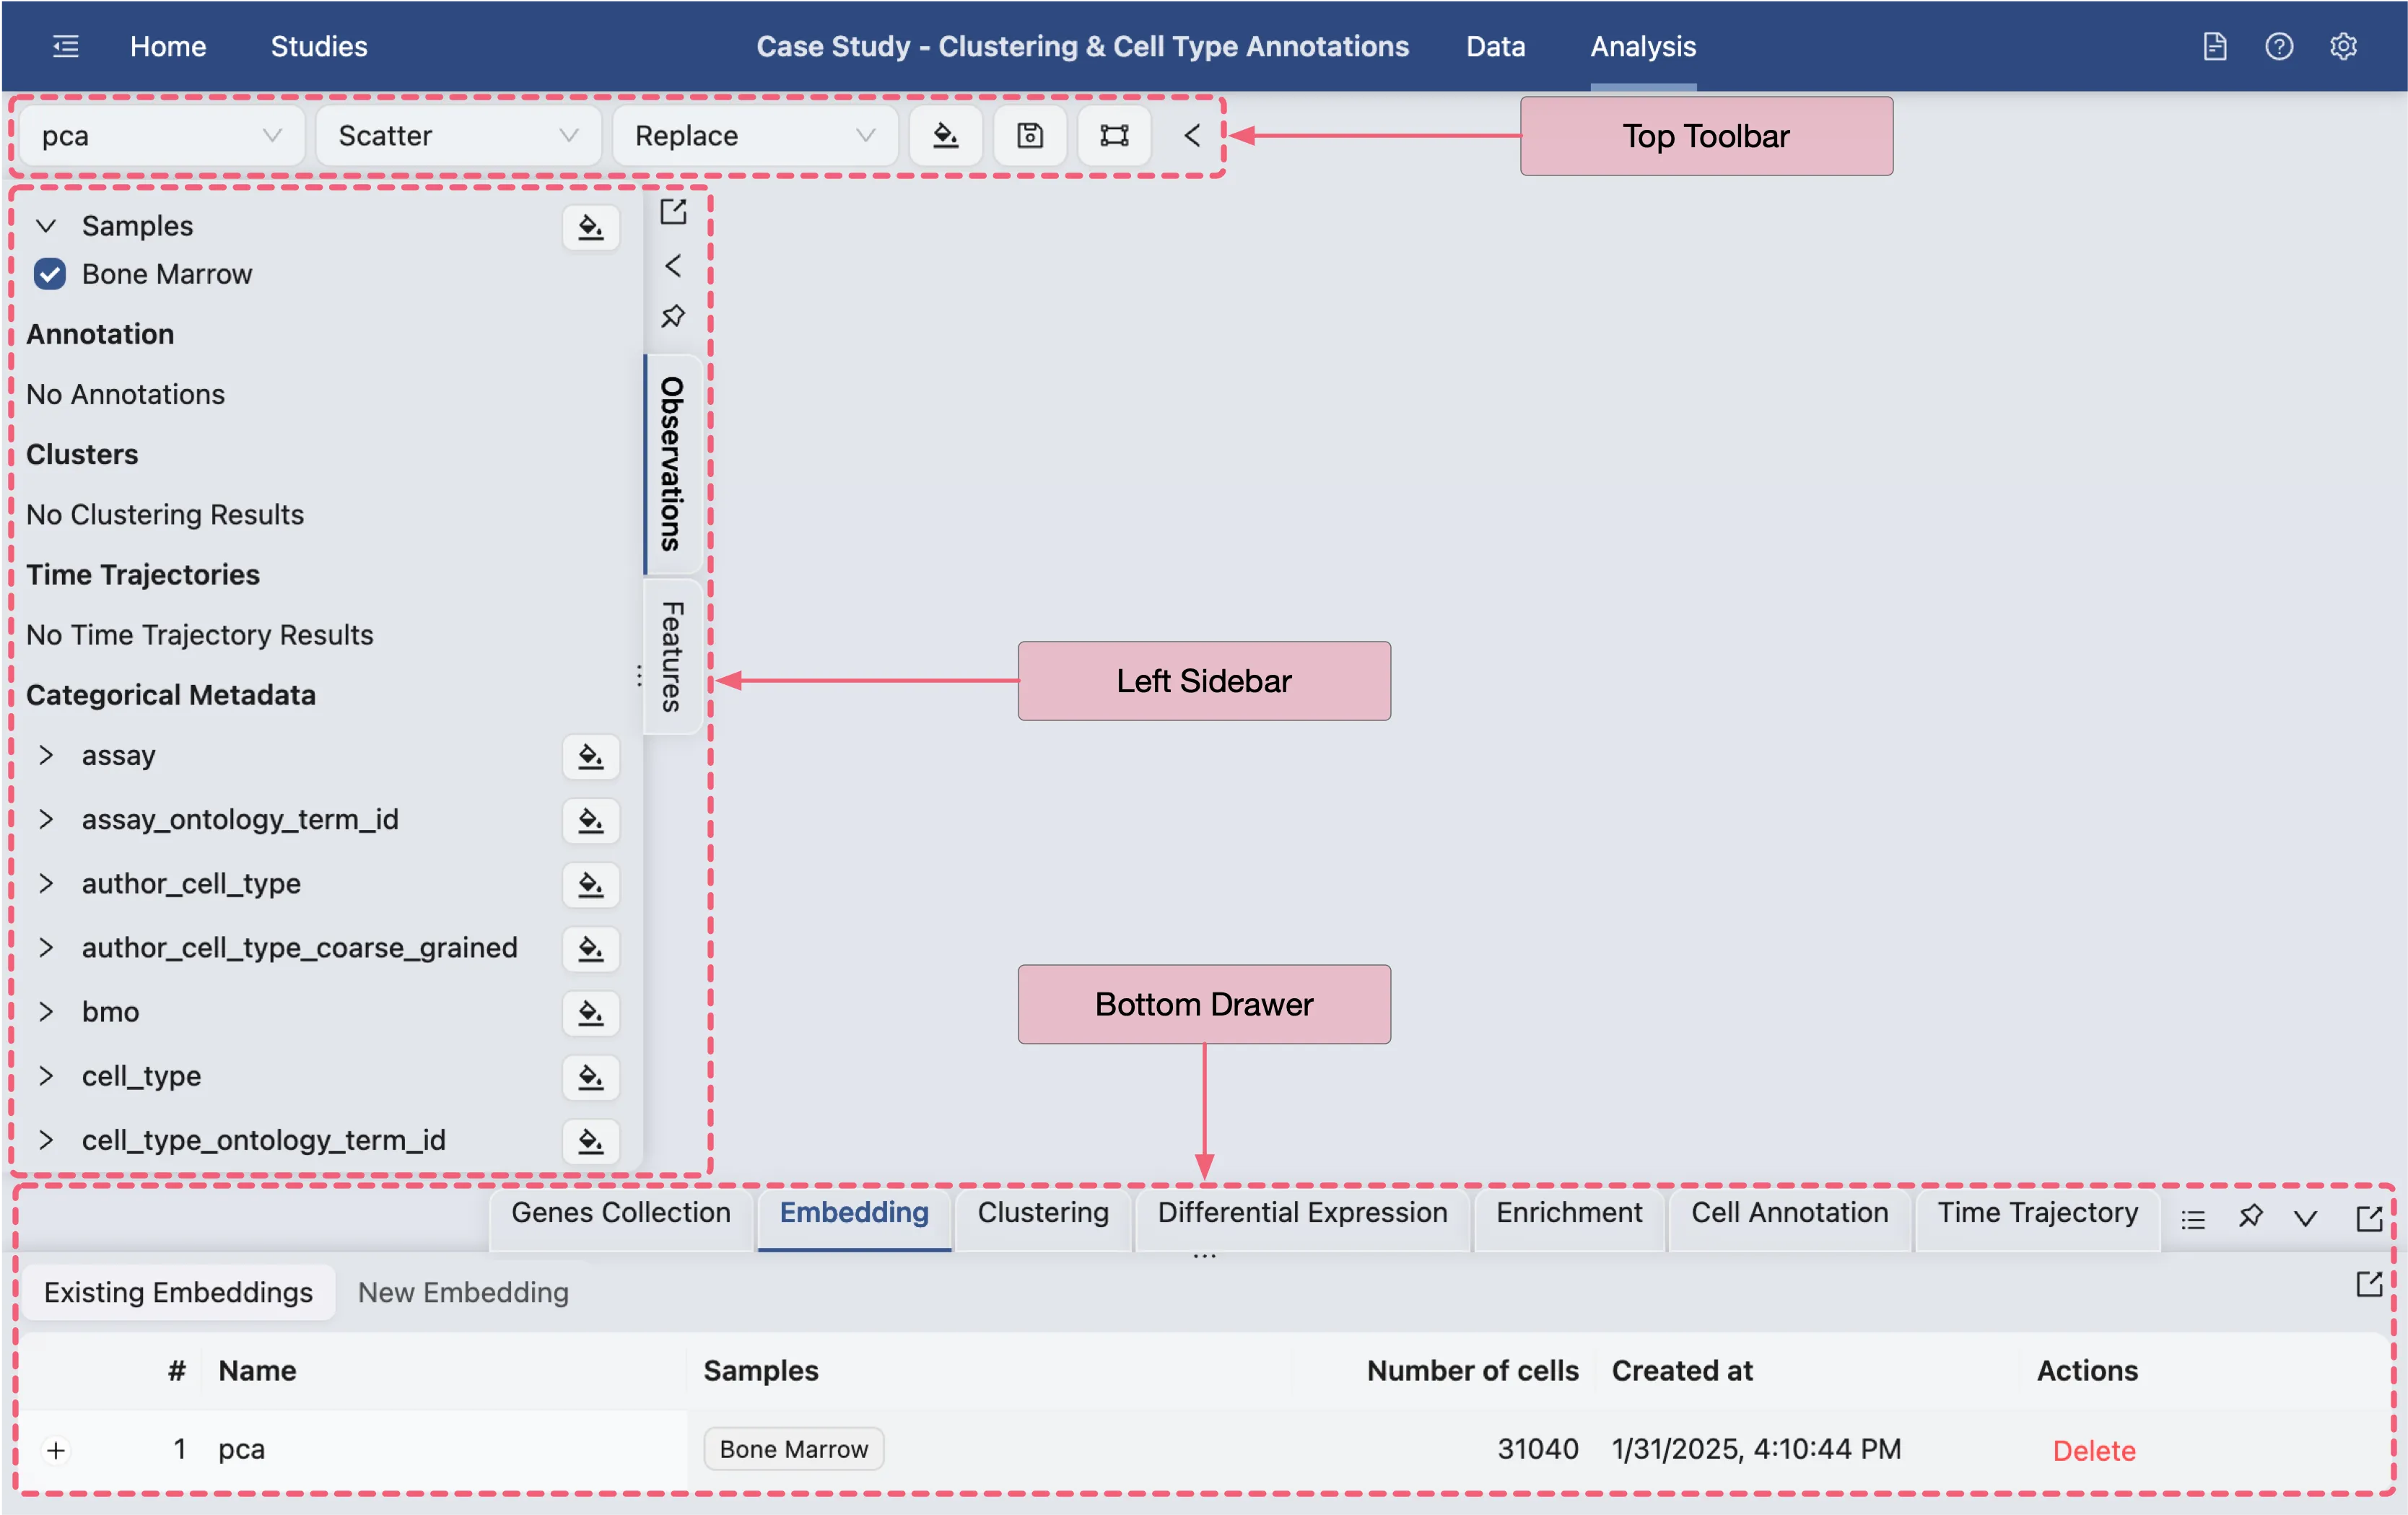
Top Toolbar: Contains dropdown menus for selecting embedding, data normalization, plot type, blending mode, and color map.
Left Sidebar: Contains the label selection panel for selecting labels to visualize.
Bottom Drawer: Contains all analysis tools
For more details about navigation and understanding the layout of the Analysis page, refer to Data Analysis.
Data Exploration
To capture the major cell populations in the dataset, we visualize the cell landscape to manually identify potential clusters.
Follow these steps to visualize the cell landscape:
Ensure that the value
Bone Marrowof theSampleslabel in the left sidebar is selected.Click the
 button next to the
 Sampleslabel to display the cell landscape.
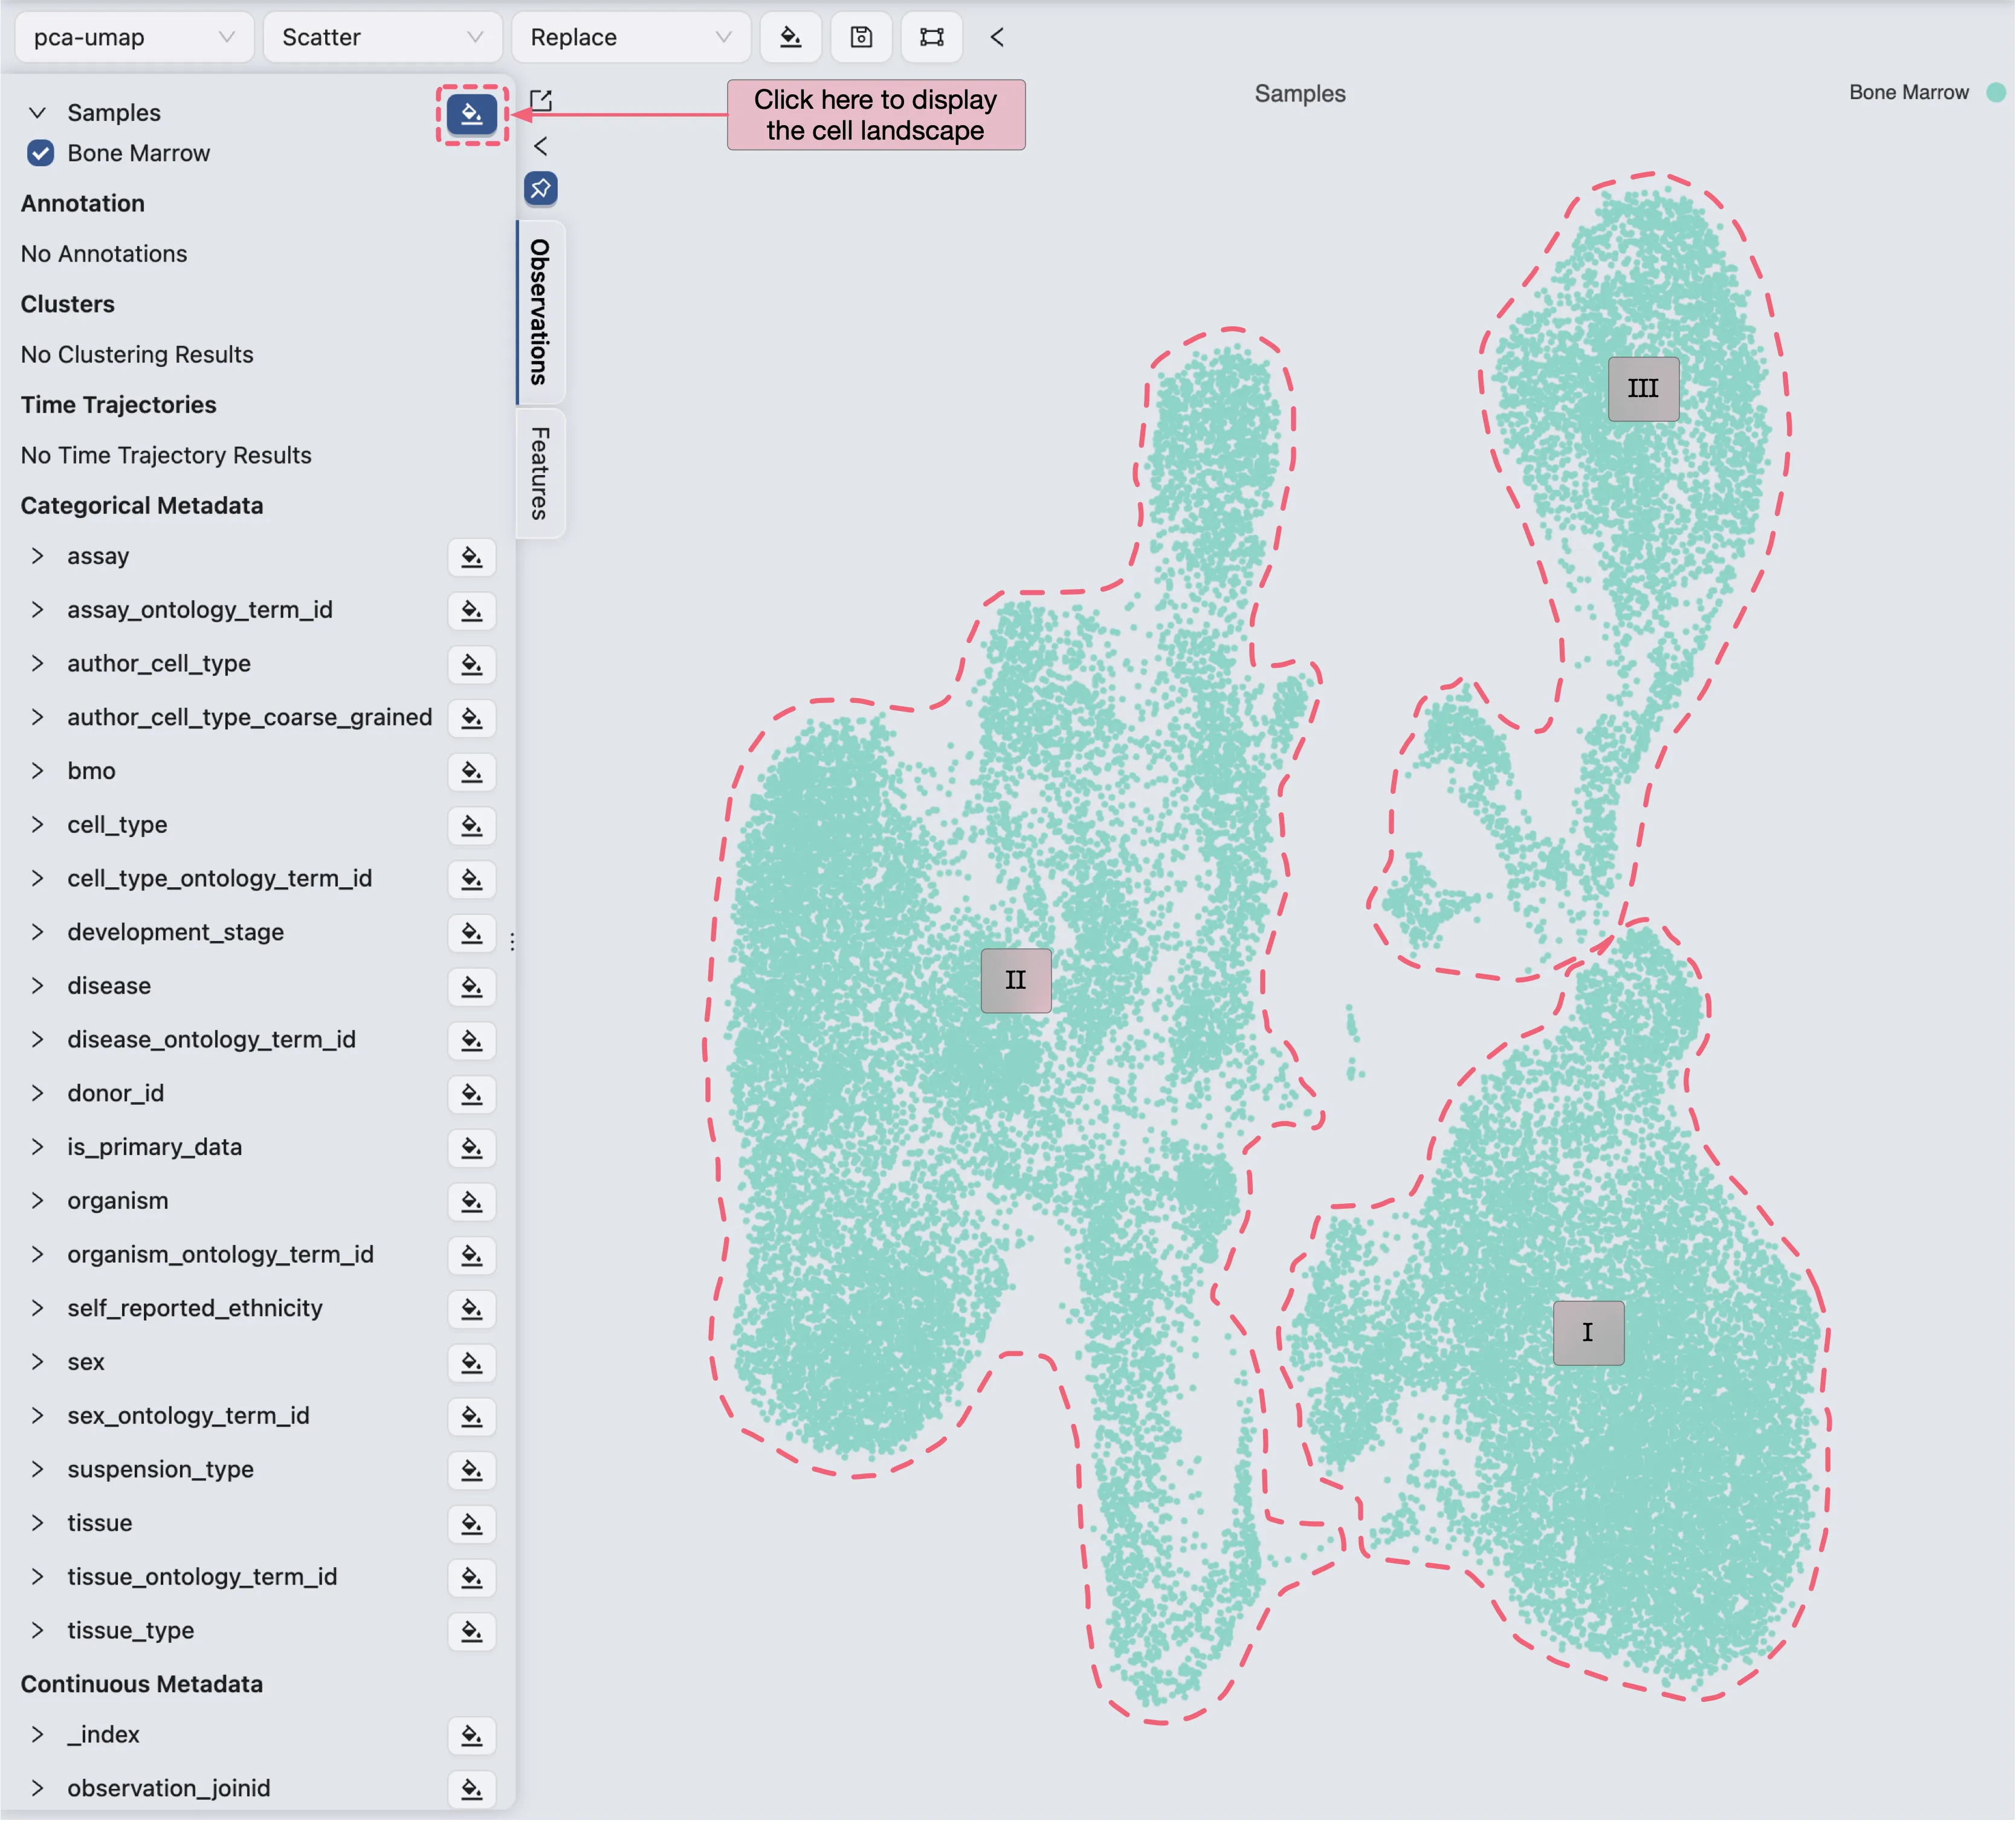
Visualizing the cell landscape reveals that the cells are distinctly separated into three clusters (marked as I, II, and III), which serve as the foundation for cell type annotation.
Clustering Analysis
Create Clustering Analysis
We perform clustering analysis on the dataset to define the boundaries of three distinct cell populations. Specifically, clustering is executed at various resolutions to examine cluster granularity and determine optimal boundaries. Multiple clustering analyses will be conducted with resolutions of 0.1, 0.2, 0.3, 0.4, and 0.5 to achieve this goal.
Follow these steps to perform the analysis:
Click the
Clusteringtab in the Bottom Drawer, then click theNew Clusteringbutton.In the clustering analysis form, use the following settings:
Embedding:
pca– Specifies the embedding to use for clustering.Name:
Louvain 0.1– The name of the clustering analysis.Method:
Louvain– The clustering method to use.Resolution:
0.1– A parameter used in Louvain or Leiden algorithms to control clustering granularity.Higher values result in more clusters.
Number of neighbors:
20- The number of nearest neighbors to consider when constructing the graph for clustering.Distance Metric:
Euclidean– The distance metric used to calculate the distance between cells.Number of Iterations:
10- The maximum number of times the algorithm will run for each random start to optimize the modularity score by refining cluster assignments.Number of random starts:
10- The number of times the clustering algorithm will be run with different initial centroid seeds; the final result will be from the run that yields the best clustering solution.
Click the
Createbutton to generate the new clustering analysis.
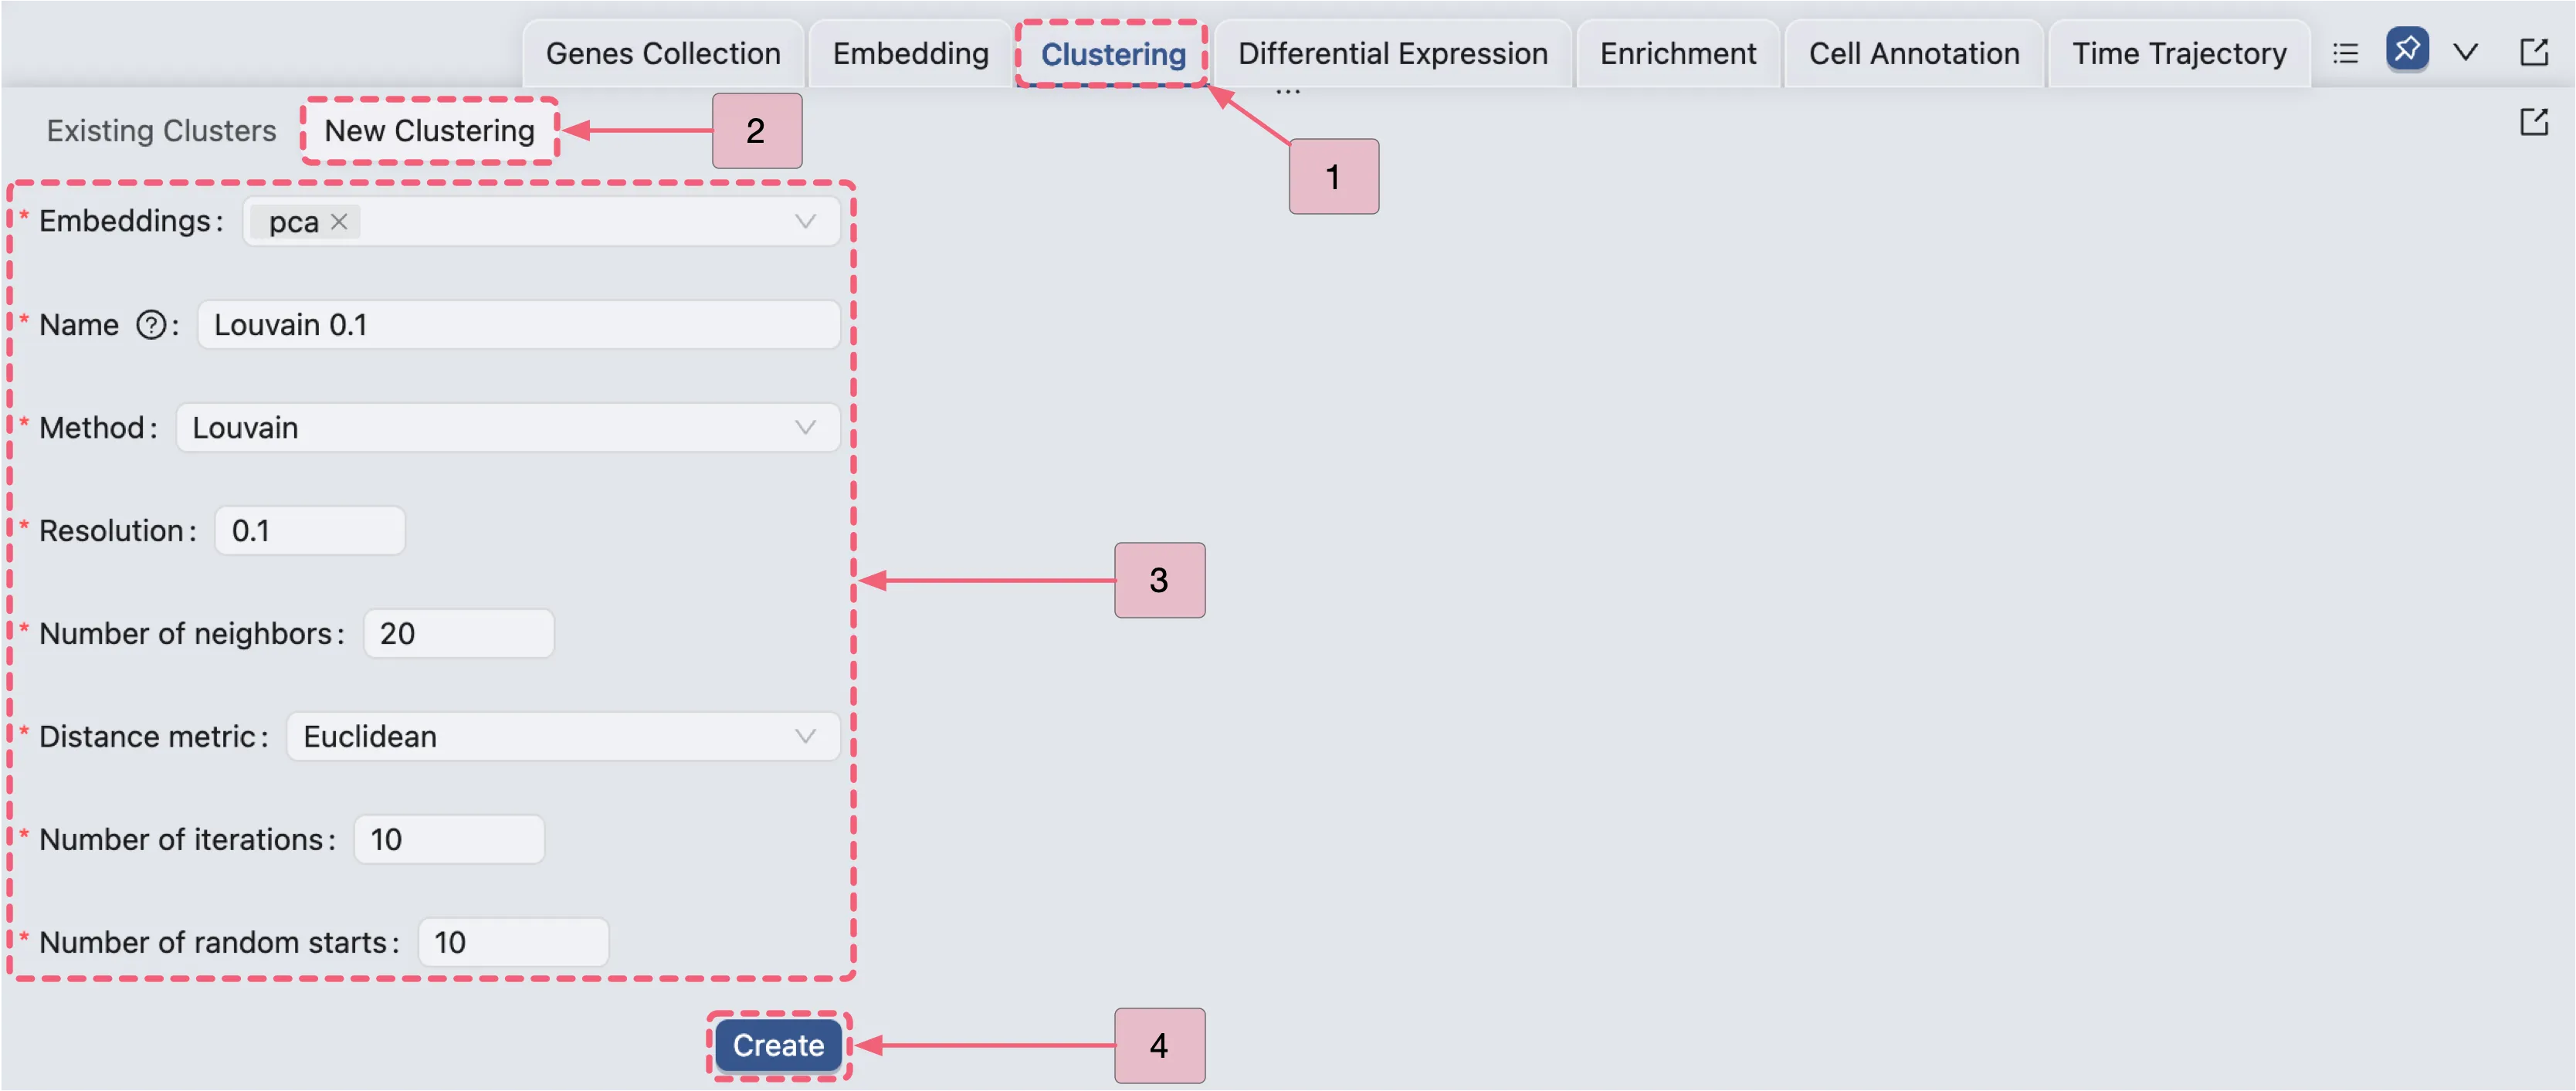
Then, we repeat the same steps to create clustering analyses with resolutions of 0.2, 0.3, 0.4, and 0.5.
The settings for these new analyses are shown in the image below:
A: Clustering form with
0.2resolution.B: Clustering form with
0.3resolution.C: Clustering form with
0.4resolution.D: Clustering form with
0.5resolution.

Visualize Clustering results
Once the clustering analysis is complete, the results will appear in the Clustering Table under the Existing Clustering tab.
To view the table:
Click the
Clusteringtab in the Bottom Drawer.Switch to the
Existing Clusteringtab to access the results.

Click the ![]() icon to view detailed analysis information next to
icon to view detailed analysis information next to Louvain 0.1, including parameters used and cell counts per cluster.
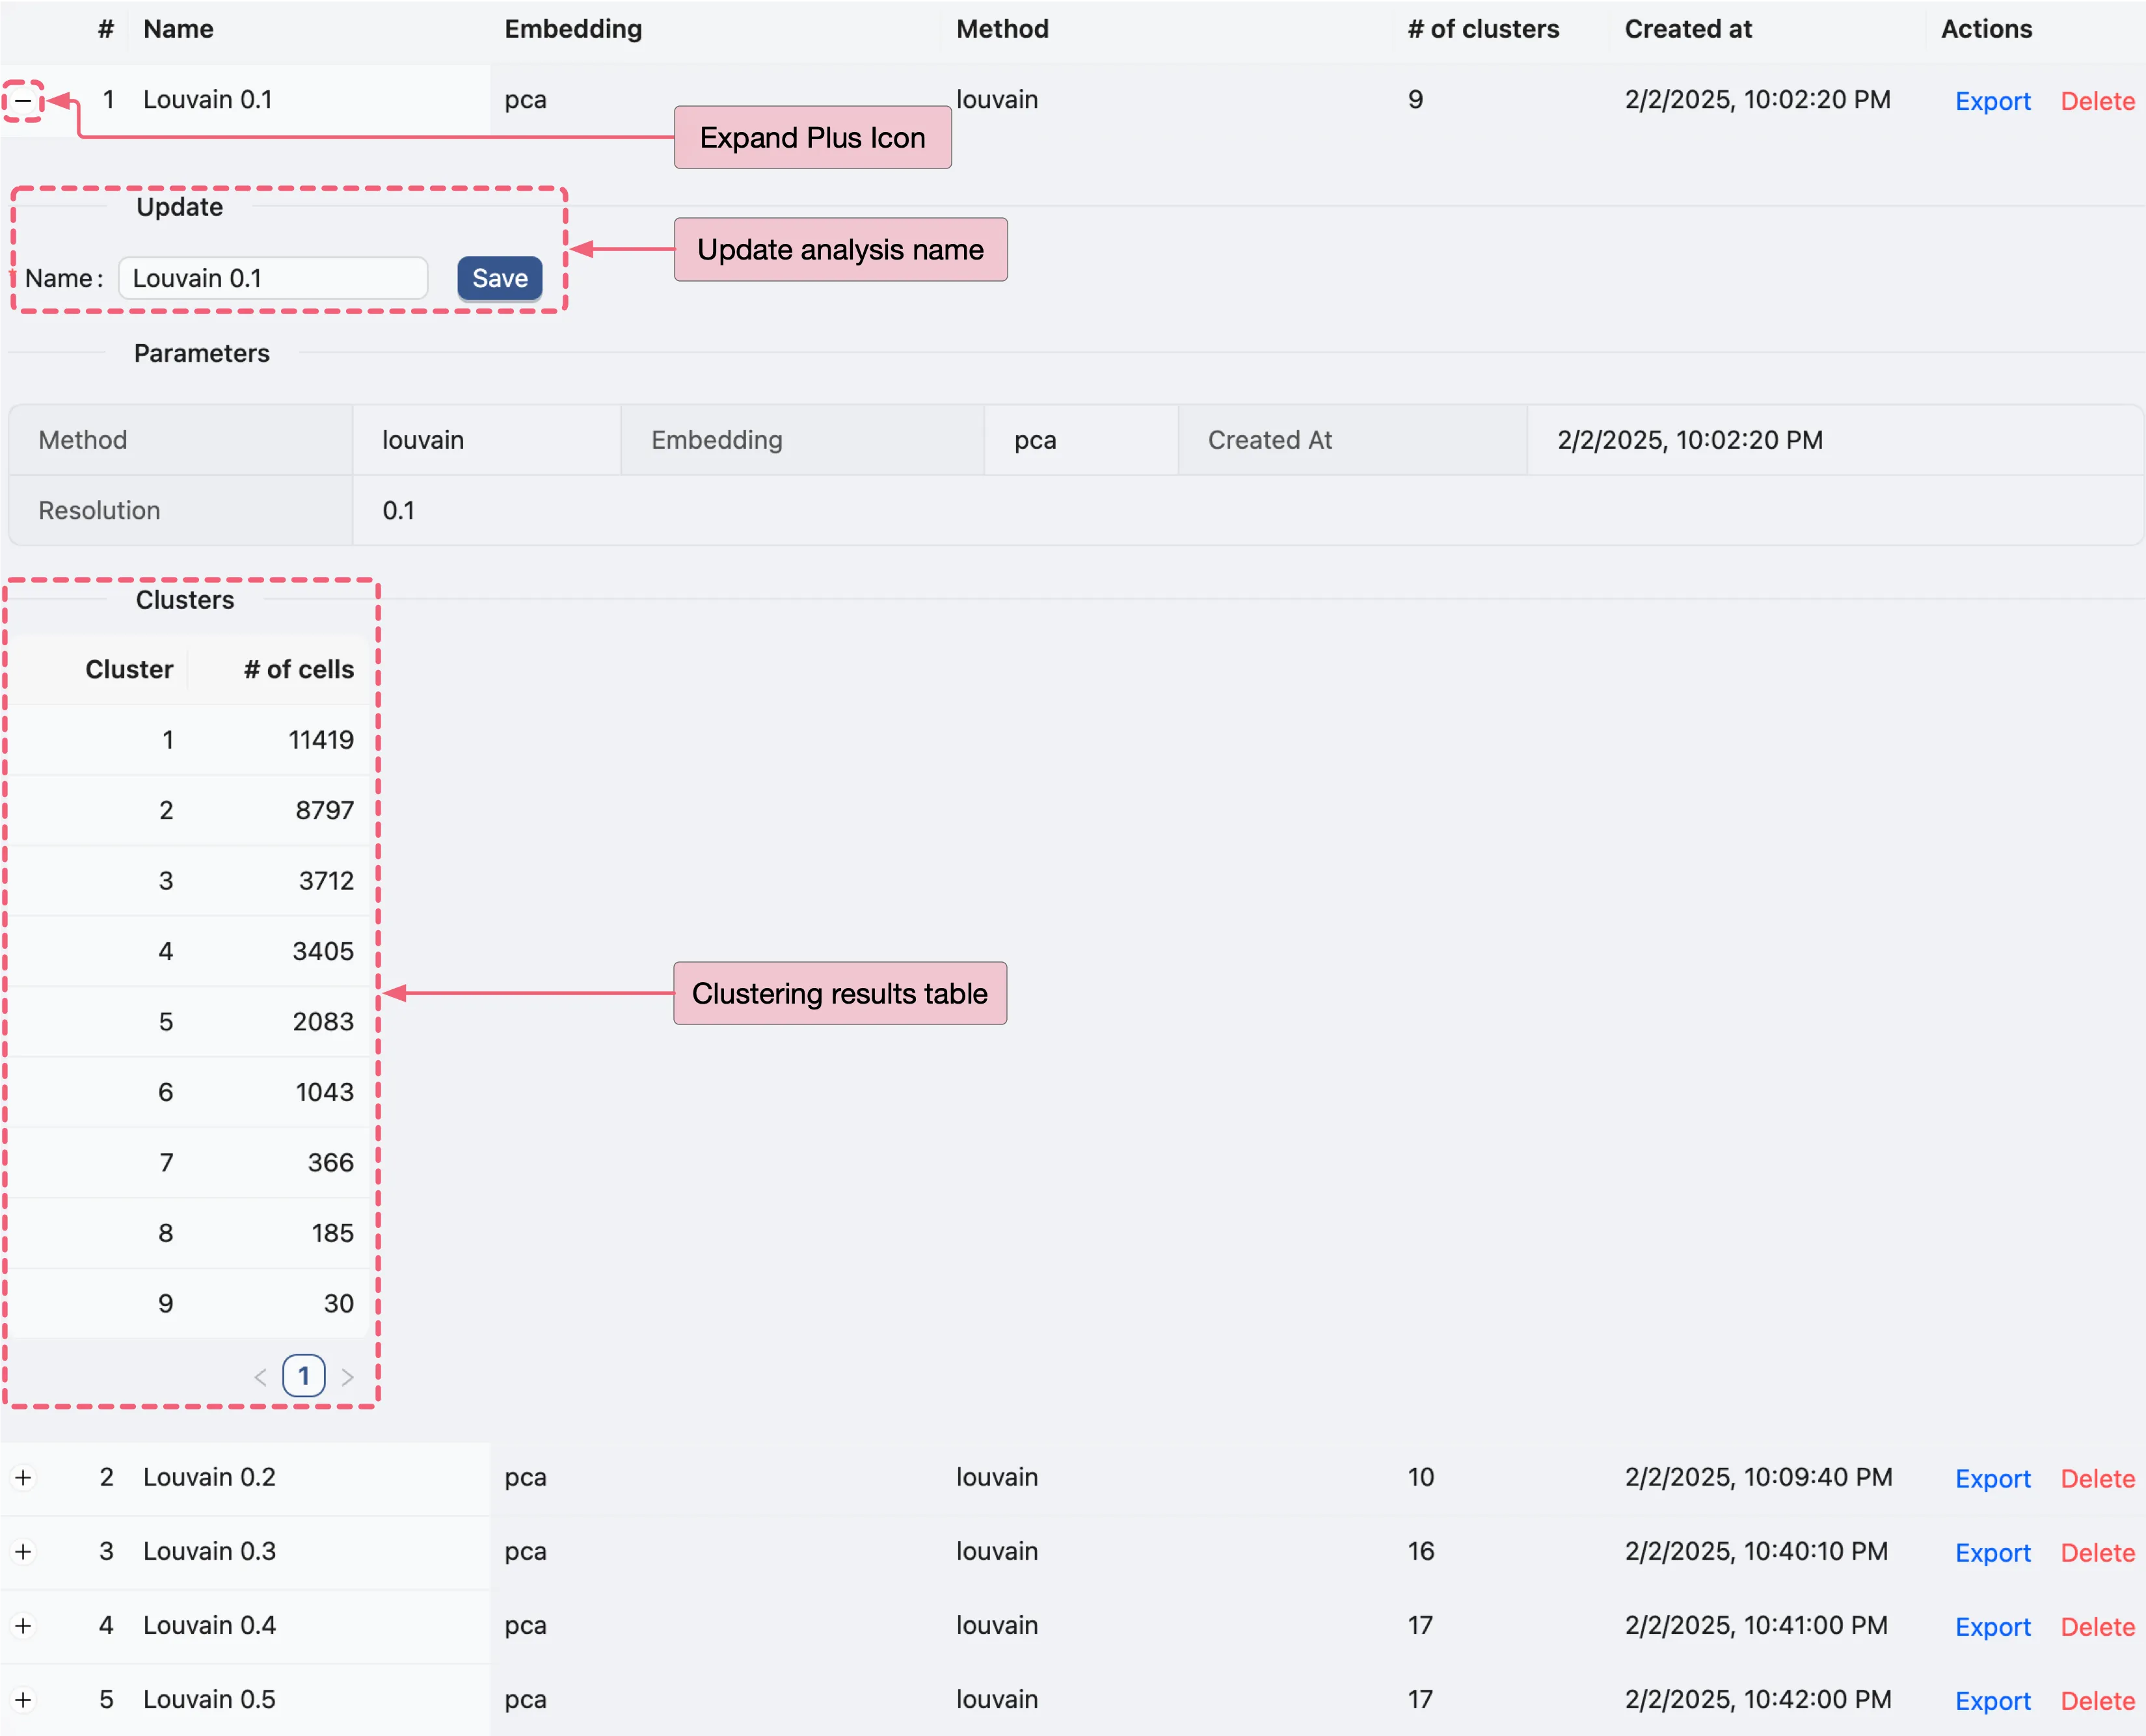
To visualize clustering results as plots, follow these steps:
In the top toolbar, ensure the settings are configured as follows:
Visualization embedding:
pca- Specifies which embedding to be used for visualization.Plot Type:
Scatter- Specifies the type of chart to display.Plot blending mode:
Separate- Specifies the blending mode for visualization.
Switch to the
Observationpanel in the left sidebar, then:Ensure the
Sampleslabel is selected.Under the Clusters category, click the
 button next to
 Louvain 0.1,Louvain 0.2,Louvain 0.3,Louvain 0.4, andLouvain 0.5to visualize the clustering results.
At this stage, the plots may not be well-arranged. Therefore, we adjust the visualization settings to organize them correctly.
In the top toolbar, click the
 button to open the visualization settings panel, and configure the following settings:
 Number of rows:
2– Specifies the number of rows in the grid layout.Sync zoom:
Enable– When enabled, zooming in on one scatter plot automatically zooms in on all scatter plots in the grid.Show plot title:
Enable– Displays the title of each plot in the grid. You can position the title to theleft,center, orright.
In the visualization settings table, focus on the key customization settings as outlined below:
Name: The name/title of the plot. You can edit the name by clicking the
 icon next to the current plot name, if desired.
Blend Mode: The blending mode applied to the plot. Blend modes can be used to combine multiple plots into one visualization. See Blend Mode for details on using blending modes.
Color: The color mapping used in the plot. Depending on the chart type, the color mapping can be of two types:
Value: Based on the expression values, such as the minimum and maximum expression values.Group: Based on groupings, such as metadata, clusters, or annotations. For more details about color customization, refer to Visualization Settings.
Action:
Click the
Removeicon to remove the plot from the grid if needed.
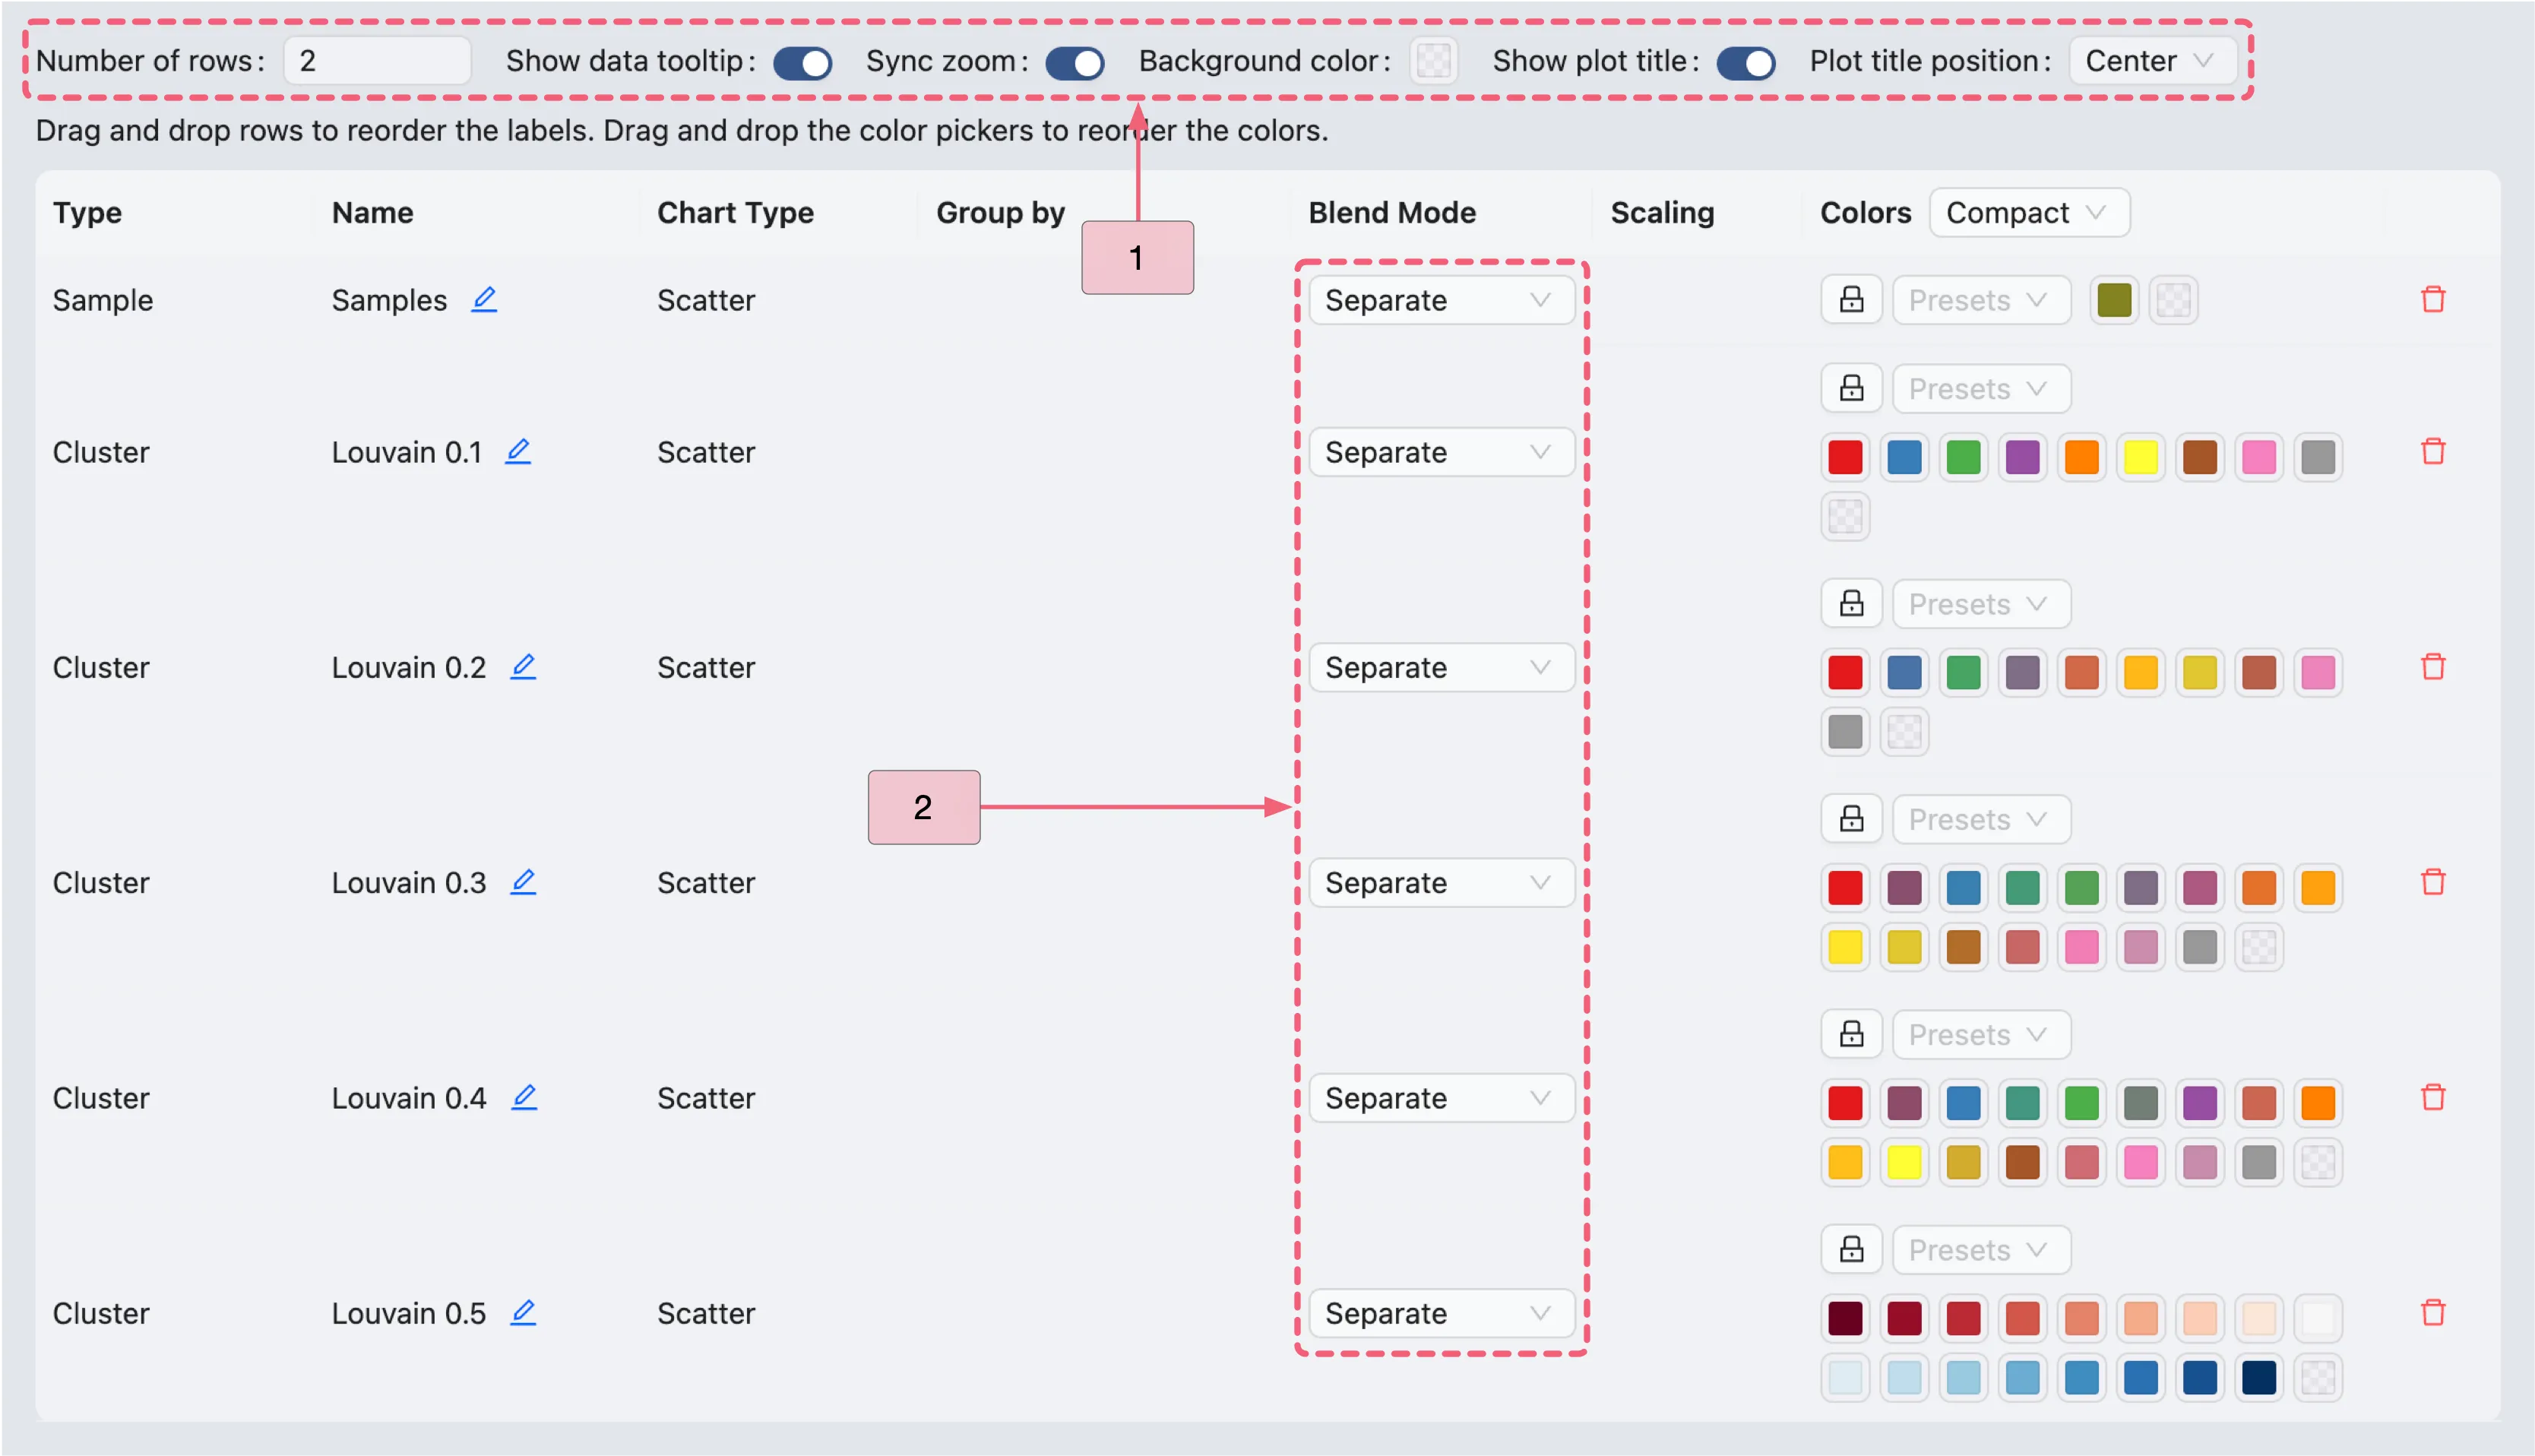
Click anywhere outside the visualization settings panel to close it. The plot details are as follows:
The first plot displays the UMAP visualization of the dataset.
The second through sixth plots show clustering results at resolutions
0.1,0.2,0.3,0.4, and0.5.
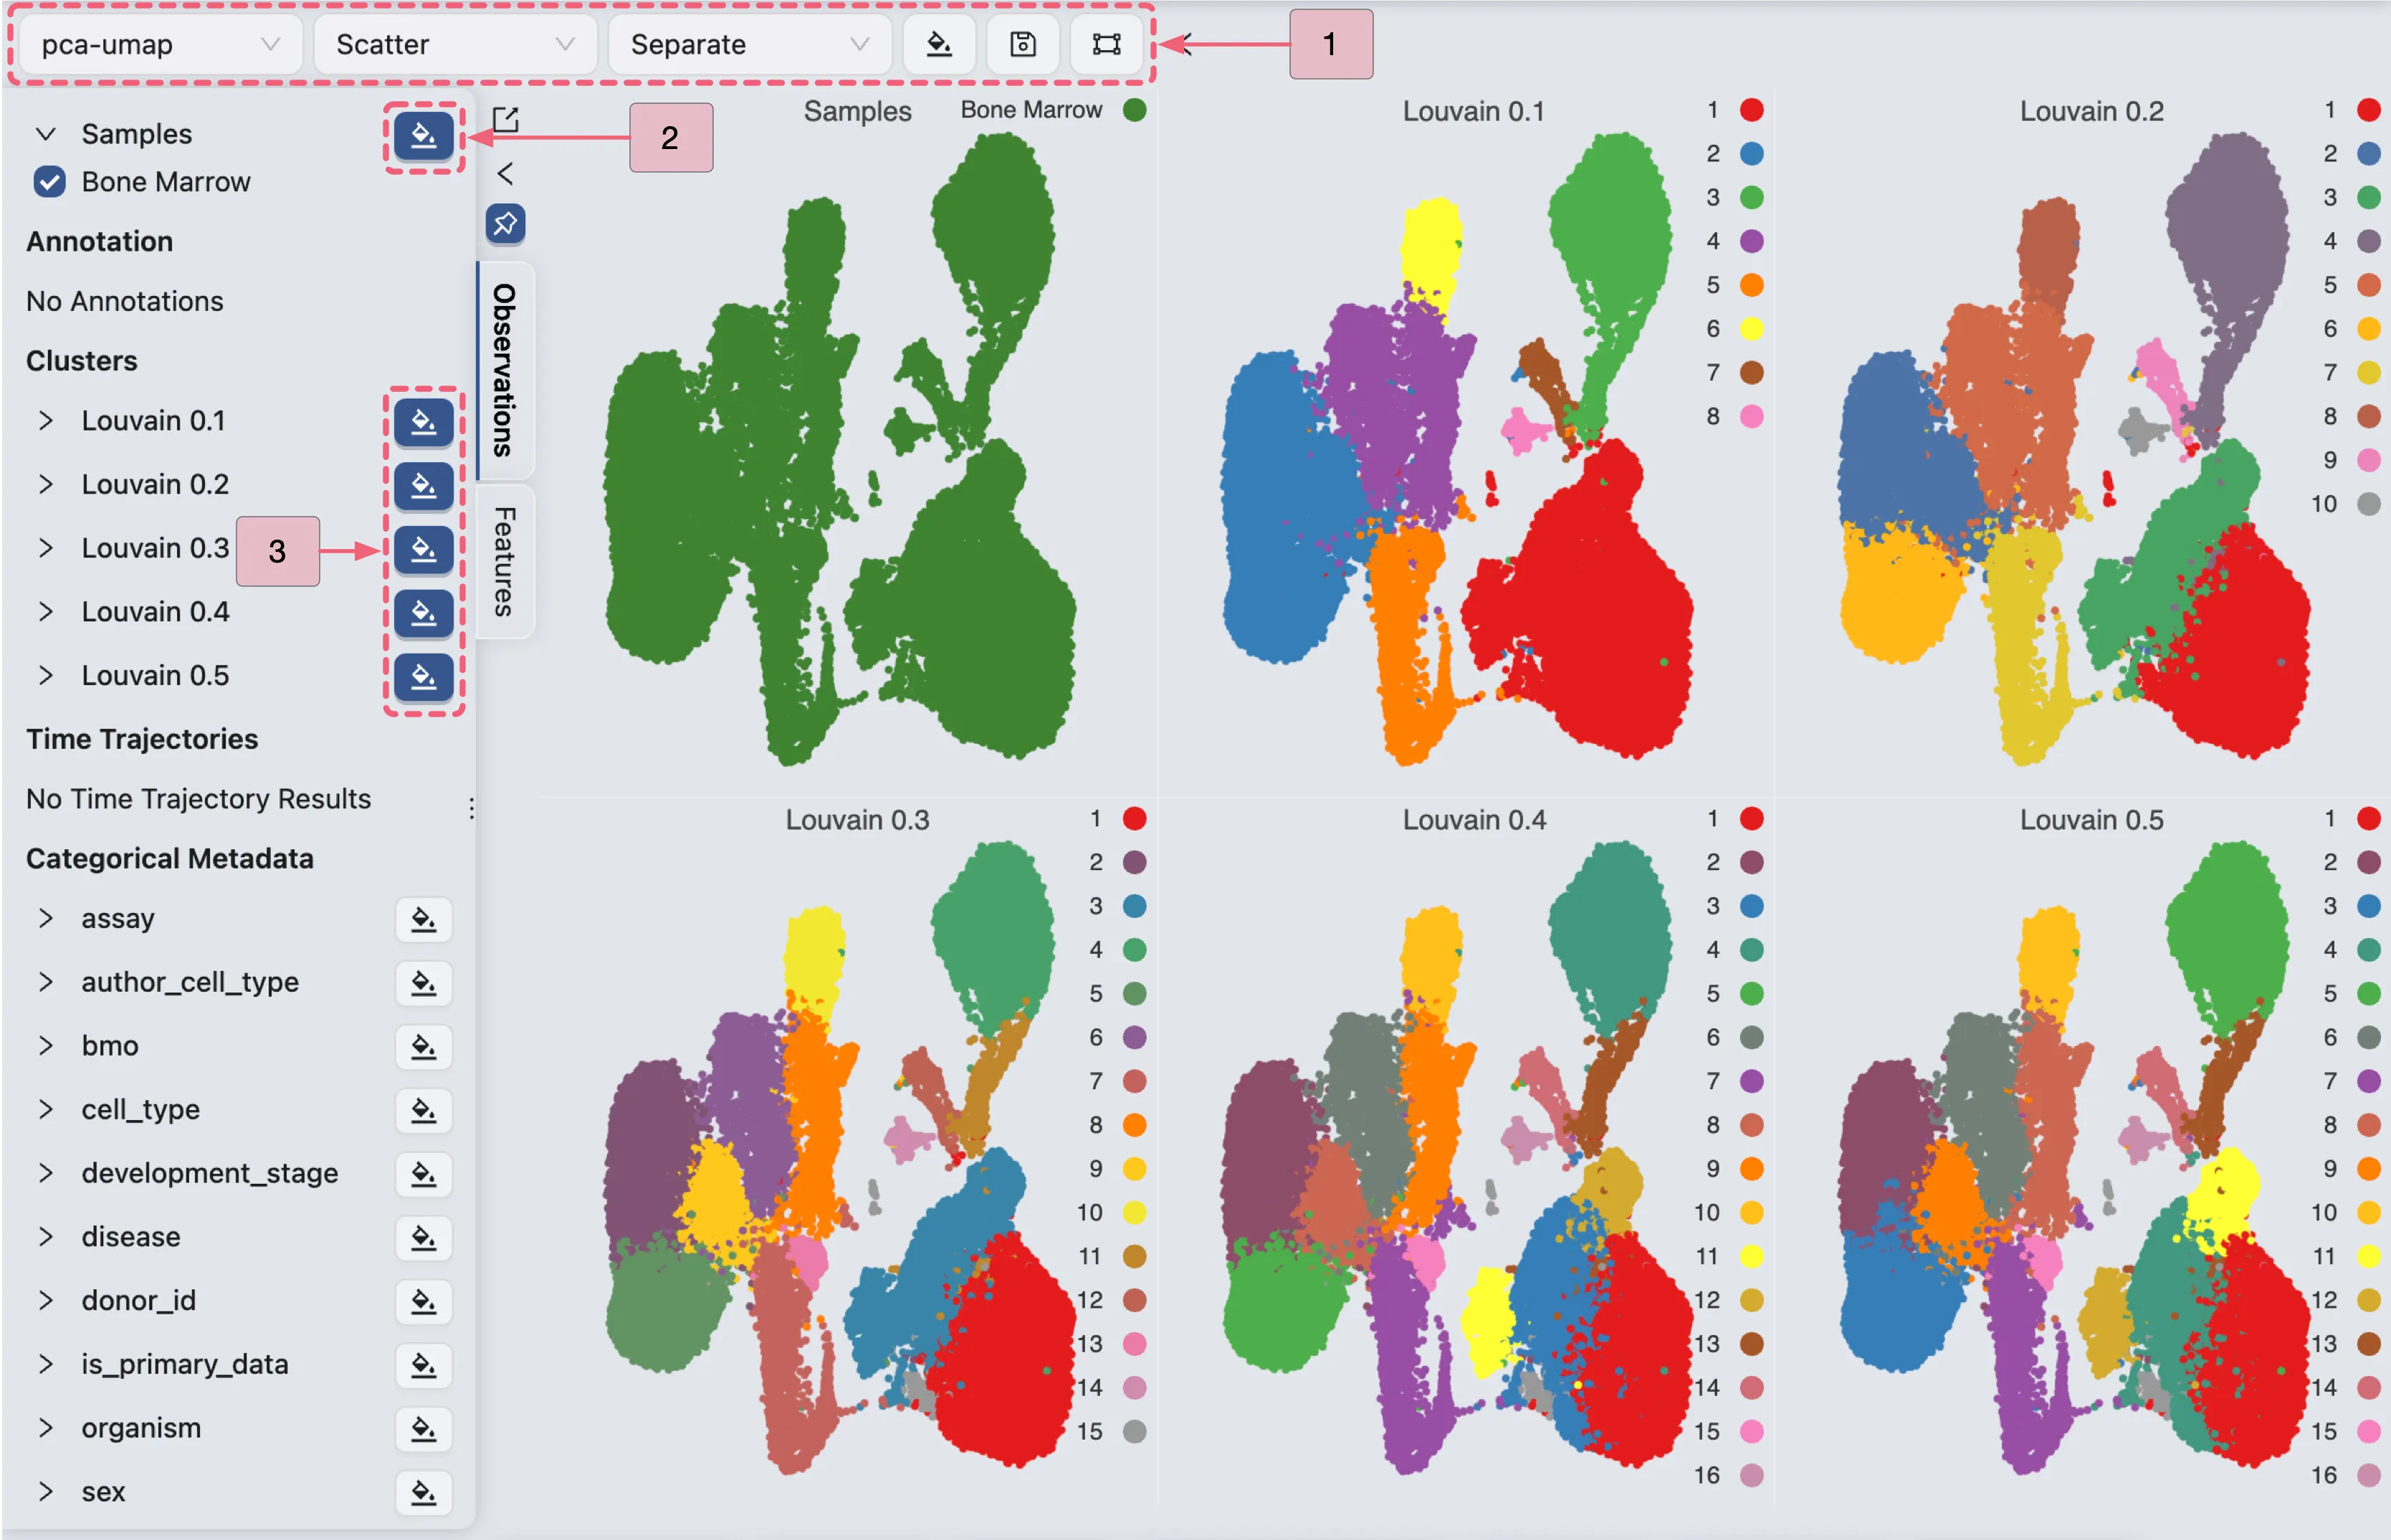
Regardless of the resolution settings, Louvain clustering successfully separates the cells into three major populations, consistent with the cell landscape visualization.
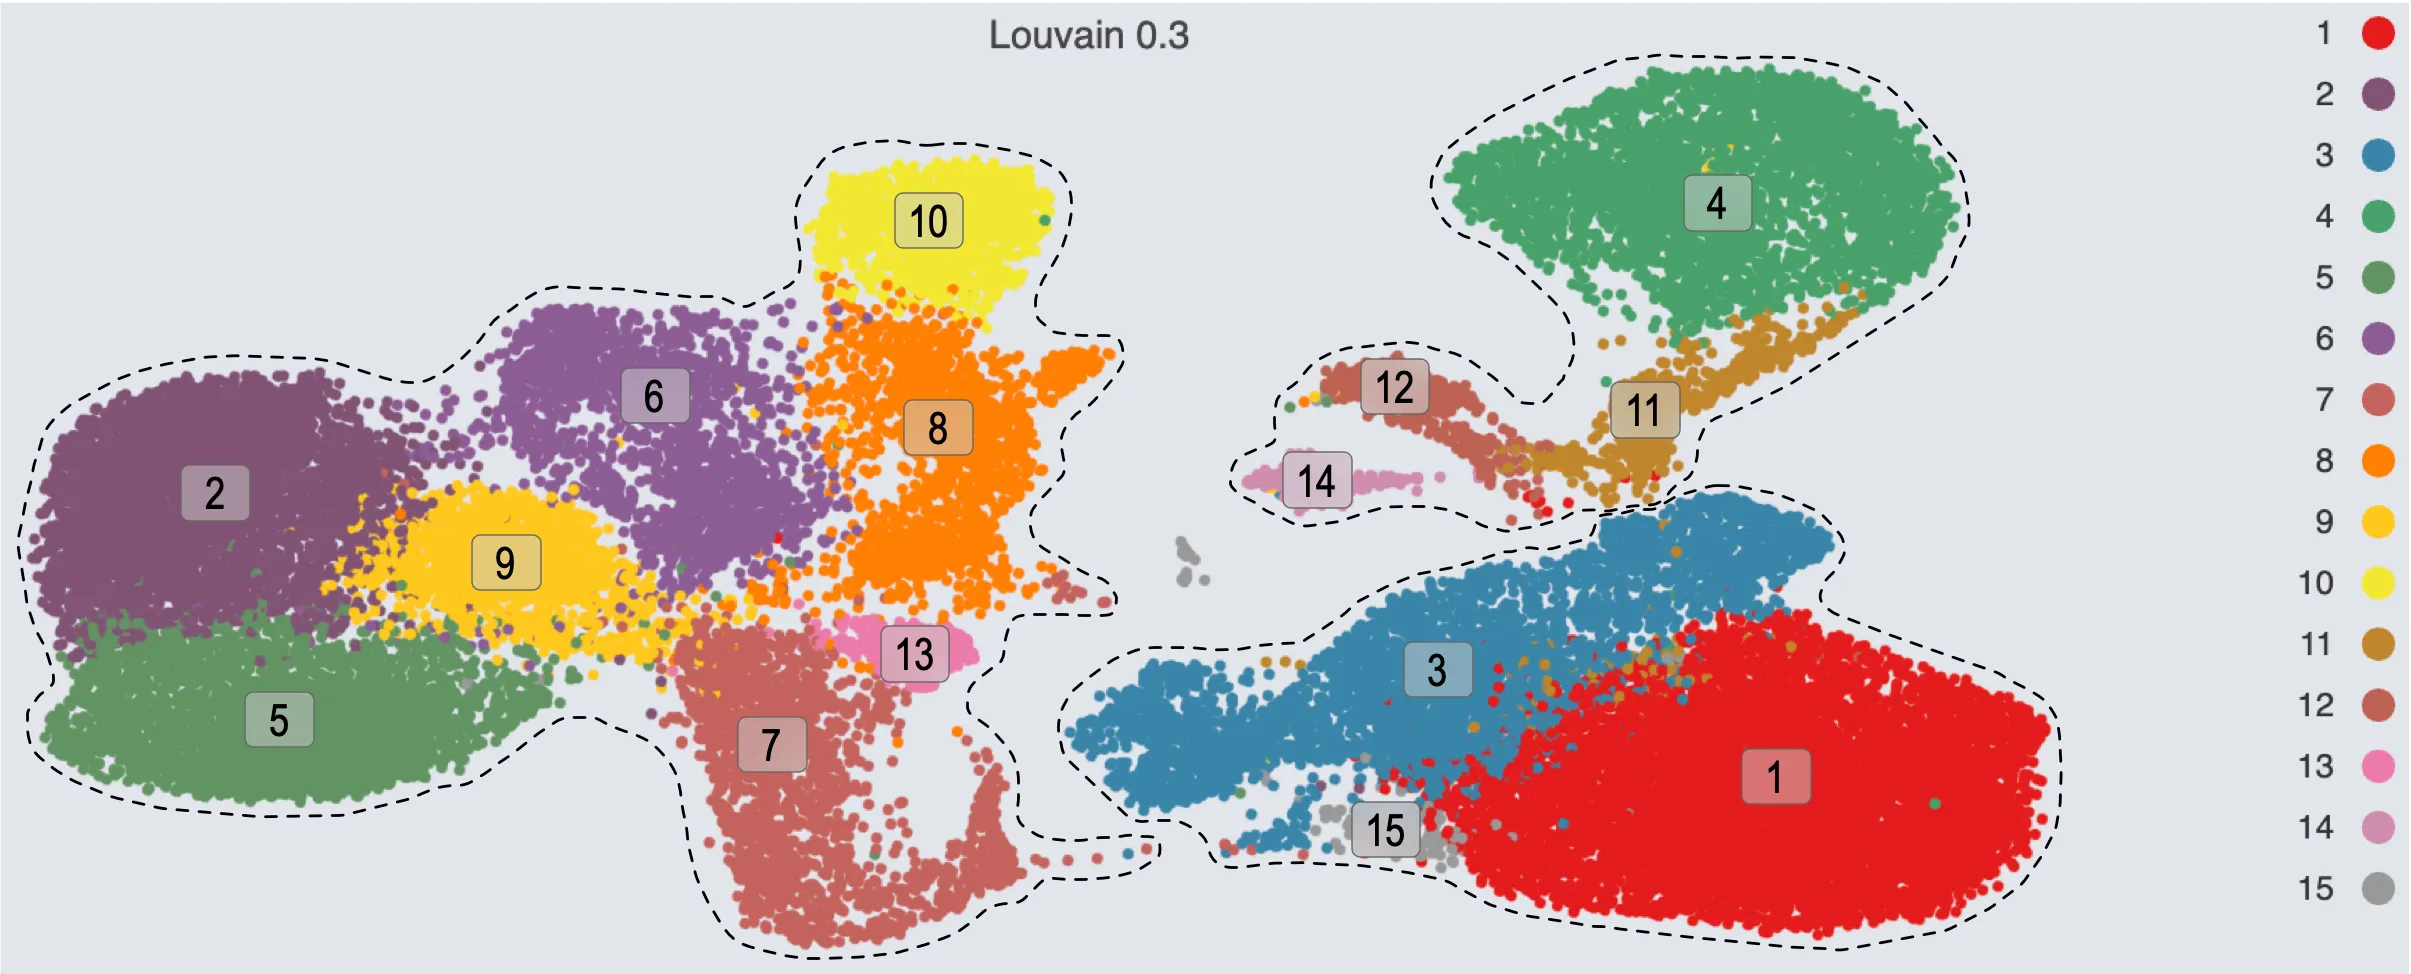
Louvain clustering with a resolutions of 0.3 identifies 15 clusters:
Clusters
1,3, and15correspond to populationI.Clusters
2,5,6,7,8,9,10, and13correspond to populationII.Clusters
4,11,12, and14correspond to populationIII.
Similarly, Louvain clustering with a resolution 0.1 identifies 8 clusters:
Cluster
1corresponds to populationI.Clusters
2,4,5, and6correspond to populationII.Clusters
3,7, and8correspond to populationIII.
In summary, Louvain analysis at different resolutions consistently separates the cell landscape into three major cell populations. For subsequent analyses, we use the default resolution of 0.3 (optimal for granularity), though all other resolutions yield similar annotation results.
Cluster Markers Identification
Population boundaries from resolution 0.3:
Population I: Clusters
1,3,15Population II: Clusters
2,5,6,7,8,9,10,13Population III: Clusters
4,11,12,14
Create a new Gene Set Collection
Before performing differential expression analysis, create a new gene set collection to store filtered DE results. Follow these steps to initialize an empty collection:
Click the
Genes Collectiontab in the Bottom Drawer to open the gene set collection panel.Click the
New Collectionbutton.Select the
Manual inputoption.Enter
Cluster Markersin the Name field to specify the collection identifier.Click the
Savebutton to create the new gene set collection.

Once the gene set collection is created, you can manage it in the Gene Set Collections table under the Existing Collections tab. Follow these steps to view the table:
Click the
Genes Collectiontab in the Bottom DrawerSwitch to the
Existing Collectionstab.

For more details about managing the existing collections, refer to Gene Set Collection.
Perform Differential Expression analysis
We identify marker genes by comparing each population against all others, while also evaluating whether populations should be divided into smaller subgroups. Three comparisons are performed:
Population I: Clusters 1, 3, 15 vs. others
Population II: Clusters 2, 5, 6, 7, 8, 9, 10, 13 vs. others
Population III: Clusters 4, 11, 12, 14 vs. others
Follow these steps to navigate to the new form for the differential expression analysis:
Click the
Differential Expressiontab on the Bottom Drawer to navigate to the analysis panel.Click the
New Differential Expressionbutton to open the analysis creation form.Select the
Customoption.

Clusters 1, 3, 15 vs others (Population I)
In the new form for the analysis, expand the following sections to configure the analysis:
Group 1 Cell FiltersandGroup 2 Cell Filters: Specify the cell filters for each group.Method Configurations: Choose the method for the analysis and define its parameters.
We will create the first analysis for Clusters 1, 3, and 15 versus others. The settings are as follows:
Name:
Clusters 1, 3, 15 vs others- The analysis identifier.Group 1 Cell Filters:
Sample:
Bone Marrow- Includes only cells from the selected sample for this group.Clustering Filters: Add filters to include cells based on clustering values. Click the
Add Clustering Filterbutton to add a new filtering condition.Clustering result:
Louvain 0.3- Indicates which clustering result is used for the filter.Clustering values:
1,3, and15- Specifies the clusters to keep in the selected clustering result.
Group 2 Cell Filters:
Sample:
Bone Marrow- Includes only cells from the selected sample for this group.Clustering Filters: Add filters to include cells based on clustering values. Click the
Add Clustering Filterbutton to add a new filtering condition.Clustering result:
Louvain 0.3- Indicates which clustering result is used for the filter.Clustering values:
2,4,5,6,7,8,9,10,11,12,13, and14- Specifies the clusters to keep in the selected clustering result.
Method Configurations: Select the method and parameters for the differential expression analysis.
Method:
Wilcoxon- Indicates the method to be used for the analysis.Max Cells:
100000- Specifies the maximum number of cells to use for the analysis.Min Percent:
0- Indicates that only gene expressed in at least this percentage of cells will be included in the analysis. In this case, we include all genes.Log Fold Change:
0.0- Indicates that only genes with a log fold change greater than this value will be included in the results. In this case, we include all genes.

After configuring the cell filters for each group and setting up the method parameters, you can preview the analysis before execution. The preview table displays the following details:
Name: The analysis name.
Group 1:
Number of cells: The number of cells in Group 1.
Samples: The selected sample for Group 1.
Clustering result: The clustering result used for Group 1 (e.g.,
Louvain 0.3).Clustering values: The specific clusters included in Group 1. (e.g.,
1,3, and15).
Group 2:
Number of cells: The number of cells in Group 2.
Samples: The selected sample for Group 2.
Clustering result: The clustering result used for Group 2 (e.g.,
Louvain 0.3).Clustering values: The specific clusters included in Group 2. (e.g.,
2,4,5,6,7,8,9,10,11,12,13, and14).
Total Cells: The combined number of cells from both groups included in the analysis.

Once reviewed, click the Submit button to run the analysis.
Clusters 2, 5, 6, 7, 8, 9, 10, 13 vs others (Population II)
We will now create the second analysis comparing clusters 2, 5, 6, 7, 8, 9, 10, and 13 against all other clusters using the same steps. Configure the analysis with the following settings:
Name:
Clusters 2, 5, 6, 7, 8, 9, 10, 13 vs others.Group 1 Cell Filters:
Sample:
Bone MarrowClustering Filters:
Clustering result:
Louvain 0.3Clustering values:
2,5,6,7,8,9,10,13
Group 2 Cell Filters:
Sample:
Bone MarrowClustering Filters:
Clustering result:
Louvain 0.3Clustering values:
1,3,4,11,12,14,15
Method Configurations:
Method:
WilcoxonMax Cells:
100000Min Percent:
0Log Fold Change:
0.0
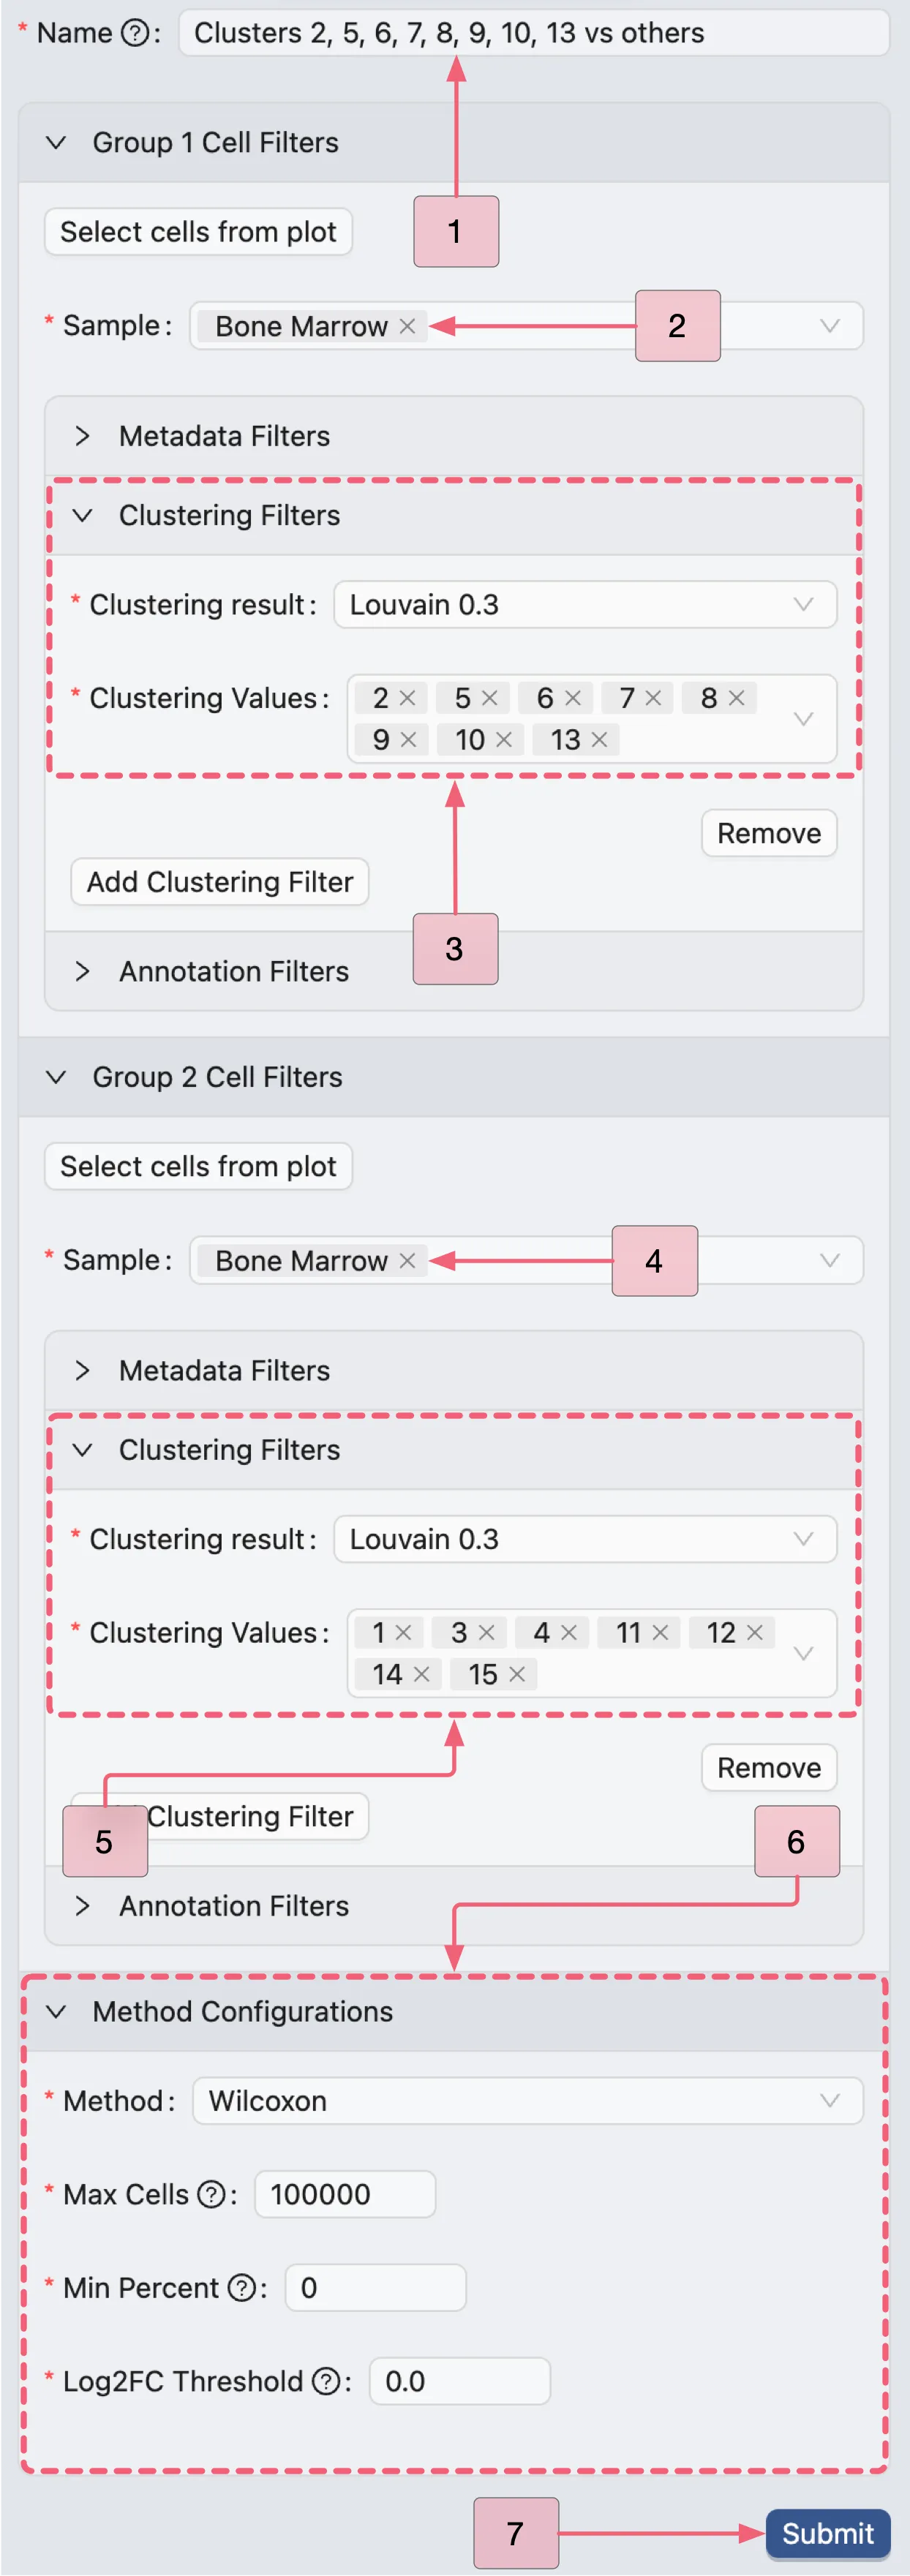
Finally, click the Submit button to run the analysis.
Clusters 4, 11, 12, 14 vs. others (Population III)
We will now create the second analysis comparing clusters 4, 11, 12, and 14 against all other clusters using the same steps. Configure the analysis with the following settings:
Name:
Clusters 4, 11, 12, 14 vs othersGroup 1 Cell Filters:
Sample:
Bone MarrowClustering Filters:
Clustering result:
Louvain 0.3Clustering values:
4,11,12,14
Group 2 Cell Filters:
Sample:
Bone MarrowClustering Filters:
Clustering result:
Louvain 0.3Clustering values:
1,2,3,5,6,7,8,9,10,13,15
Method Configurations:
Method:
WilcoxonMax Cells:
100000Min Percent:
0Log Fold Change:
0.0

Finally, click the Submit button to create the analysis.
Manage The Differential Expression Results
When the differential expression (DE) analysis completes, the results will appear in the Differential Expression Table under the Existing Results tab.
The results table displays the following information for each analysis:
Name: Analysis identifier.
Method: Statistical method used (e.g., Wilcoxon).
Max Cells: Maximum cell count parameter.
Min Pct: Minimum expression percentage threshold.
Min Log2FC: Minimum log2 fold change threshold.
Group 1: Summary of Group 1.
Group 2: Summary of Group 2.
Action:
View: Open detailed results for the analysis.
Delete: Remove the analysis from the table.
Additionally, CytoAnalyst supports viewing multiple DE analyses results simultaneously:
Select one or more analyses using the checkboxes on the left side of the table.
Click the
View Selectedbutton at the top of the table to view the selected analyses results in the same window.
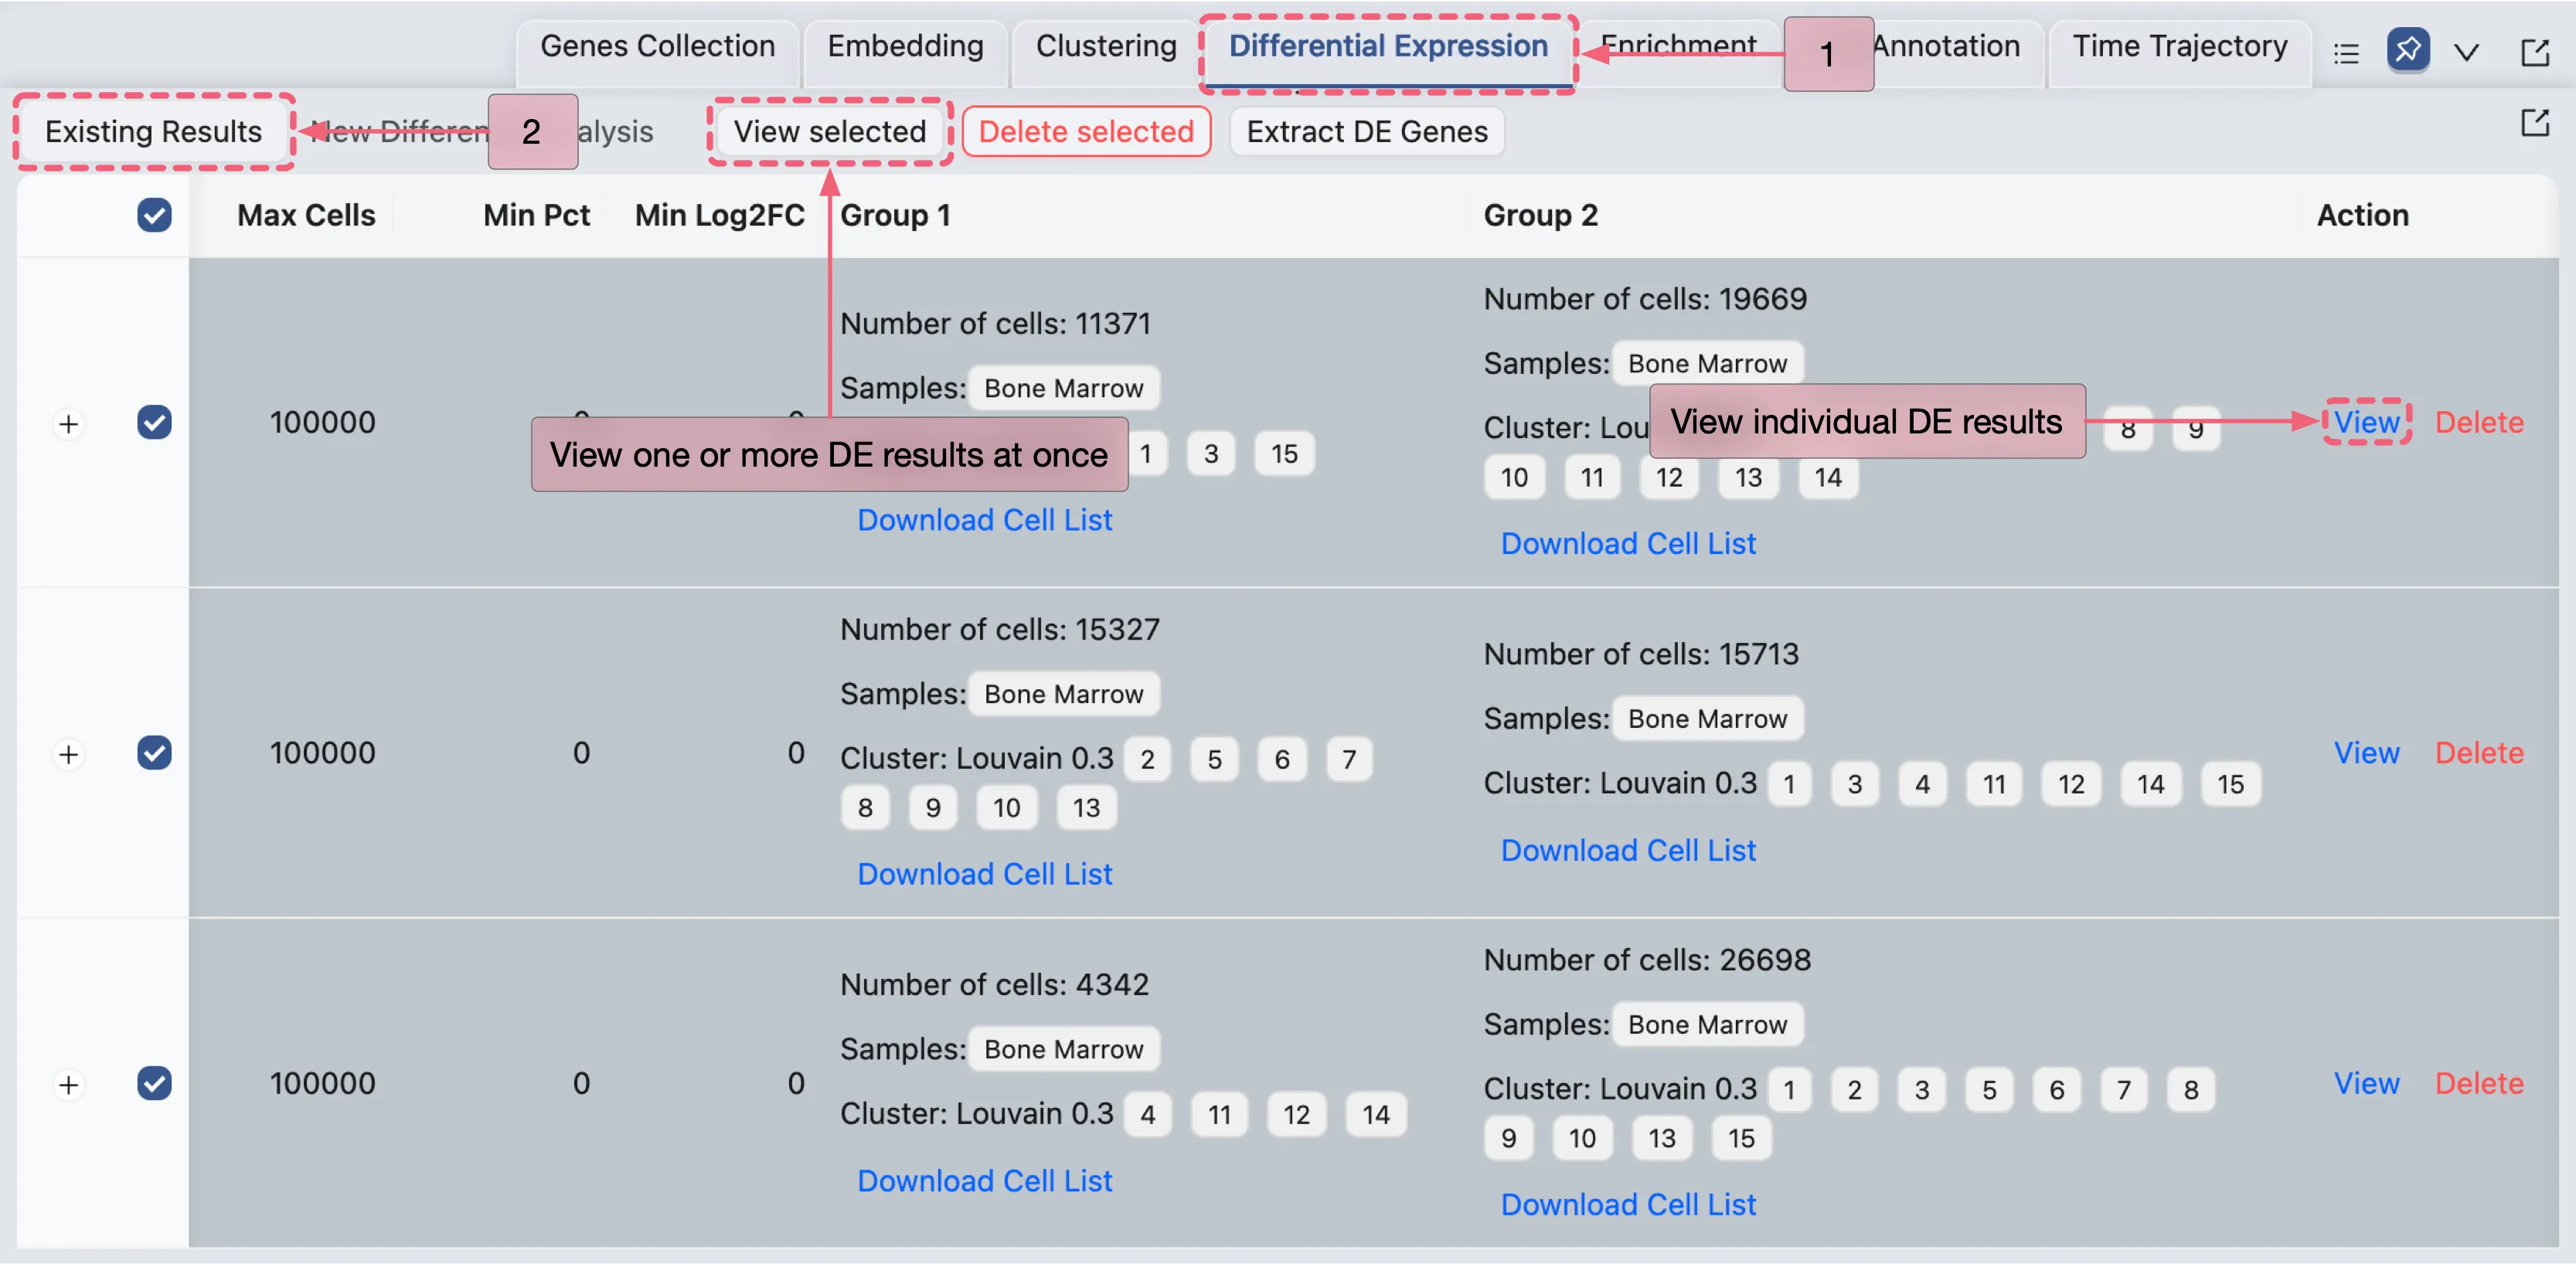
For comprehensive guidance on managing DE results, see the Differential Expression Analysis page.
Identify Marker Genes
To extract marker genes, there are two primary approaches for filtering genes and adding them to a gene set collection:
Extract DE genes using individual DE results.
Alternative approach (Recommended) Extract DE genes using multiple DE results simultaneously.
Extract DE genes using individual DE results
In the Action column of the Differential Expression Table, click the View button to open the DE results page for the first analysis (Clusters 1, 3, 15 vs others).

The differential expression results page consists of four main components:
Results table - Displays the differential expression results. Use the
Show columnssection to customize which columns are visible.Add selected genes to Gene Set Collection - This panel allows you to add selected genes to a gene set collection with two options:
Add to existing set: Add the selected genes to an existing set in the chosen collection.
Create new set: Create a new set within the selected collection.
Analysis parameters - Displays the parameters used for the differential expression analysis.
Volcano plot - Shows the log fold change (x-axis) versus -log10(p-value) (y-axis). Significantly differentially expressed genes are highlighted.
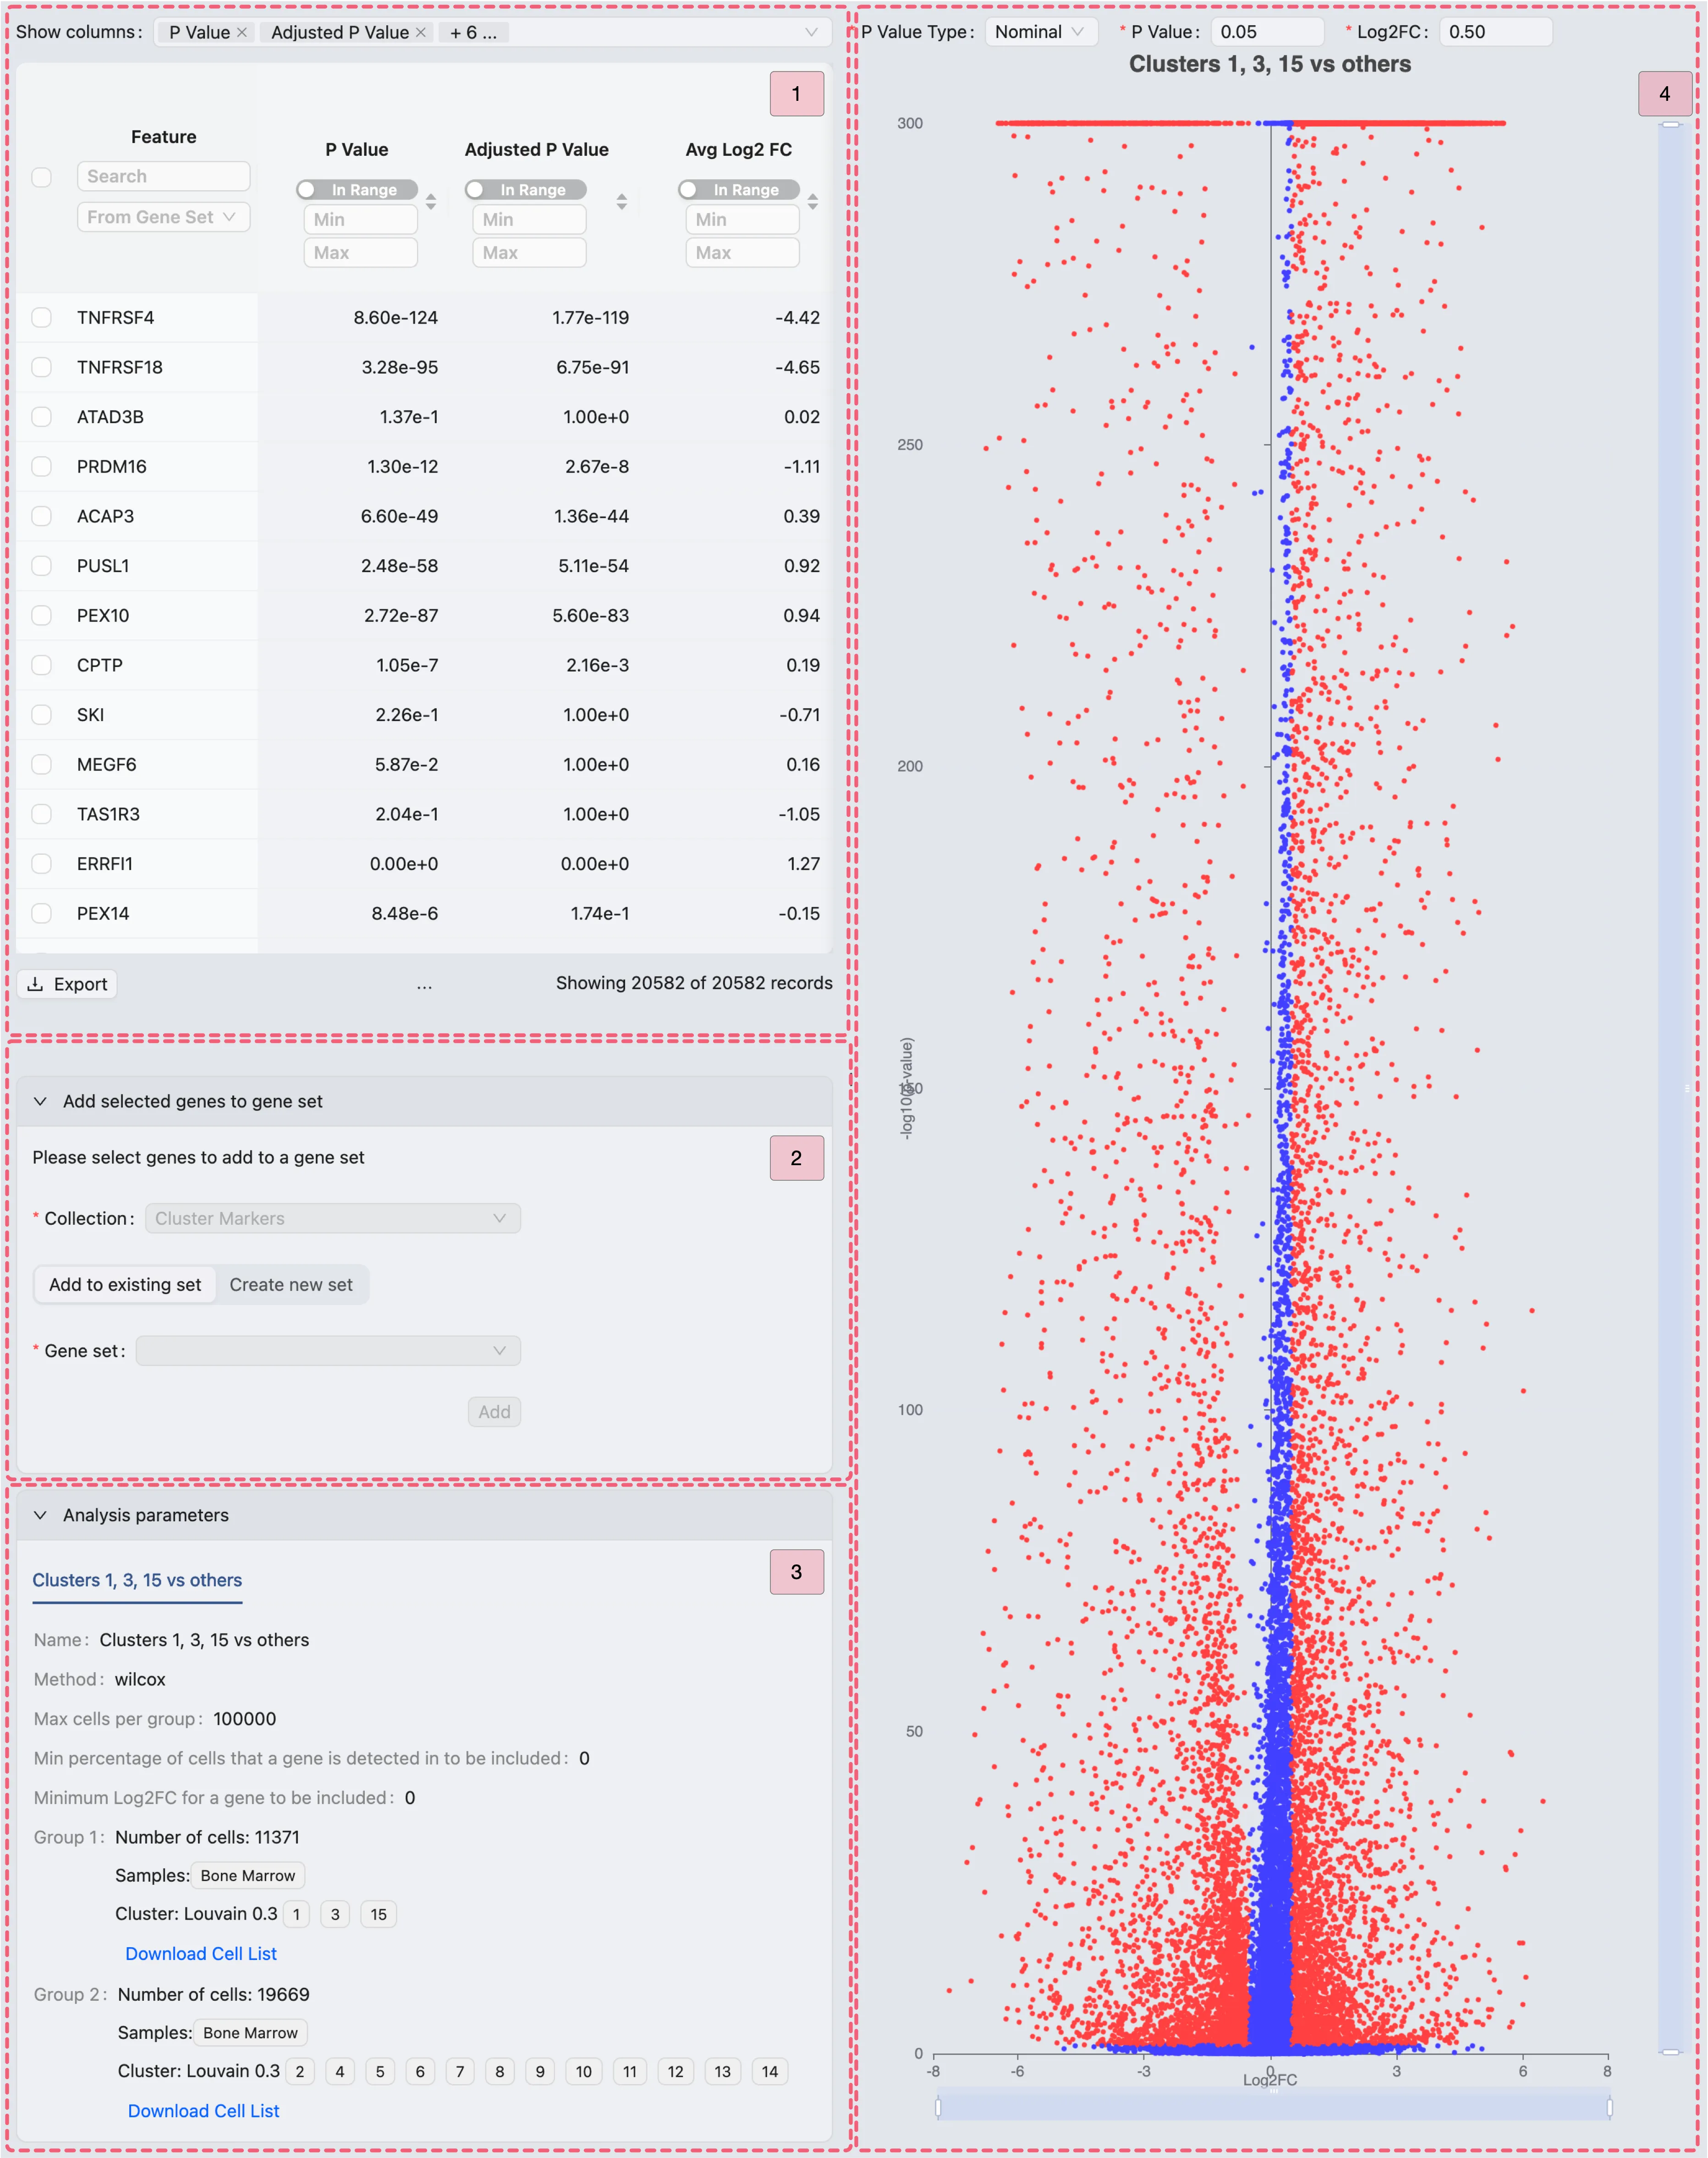
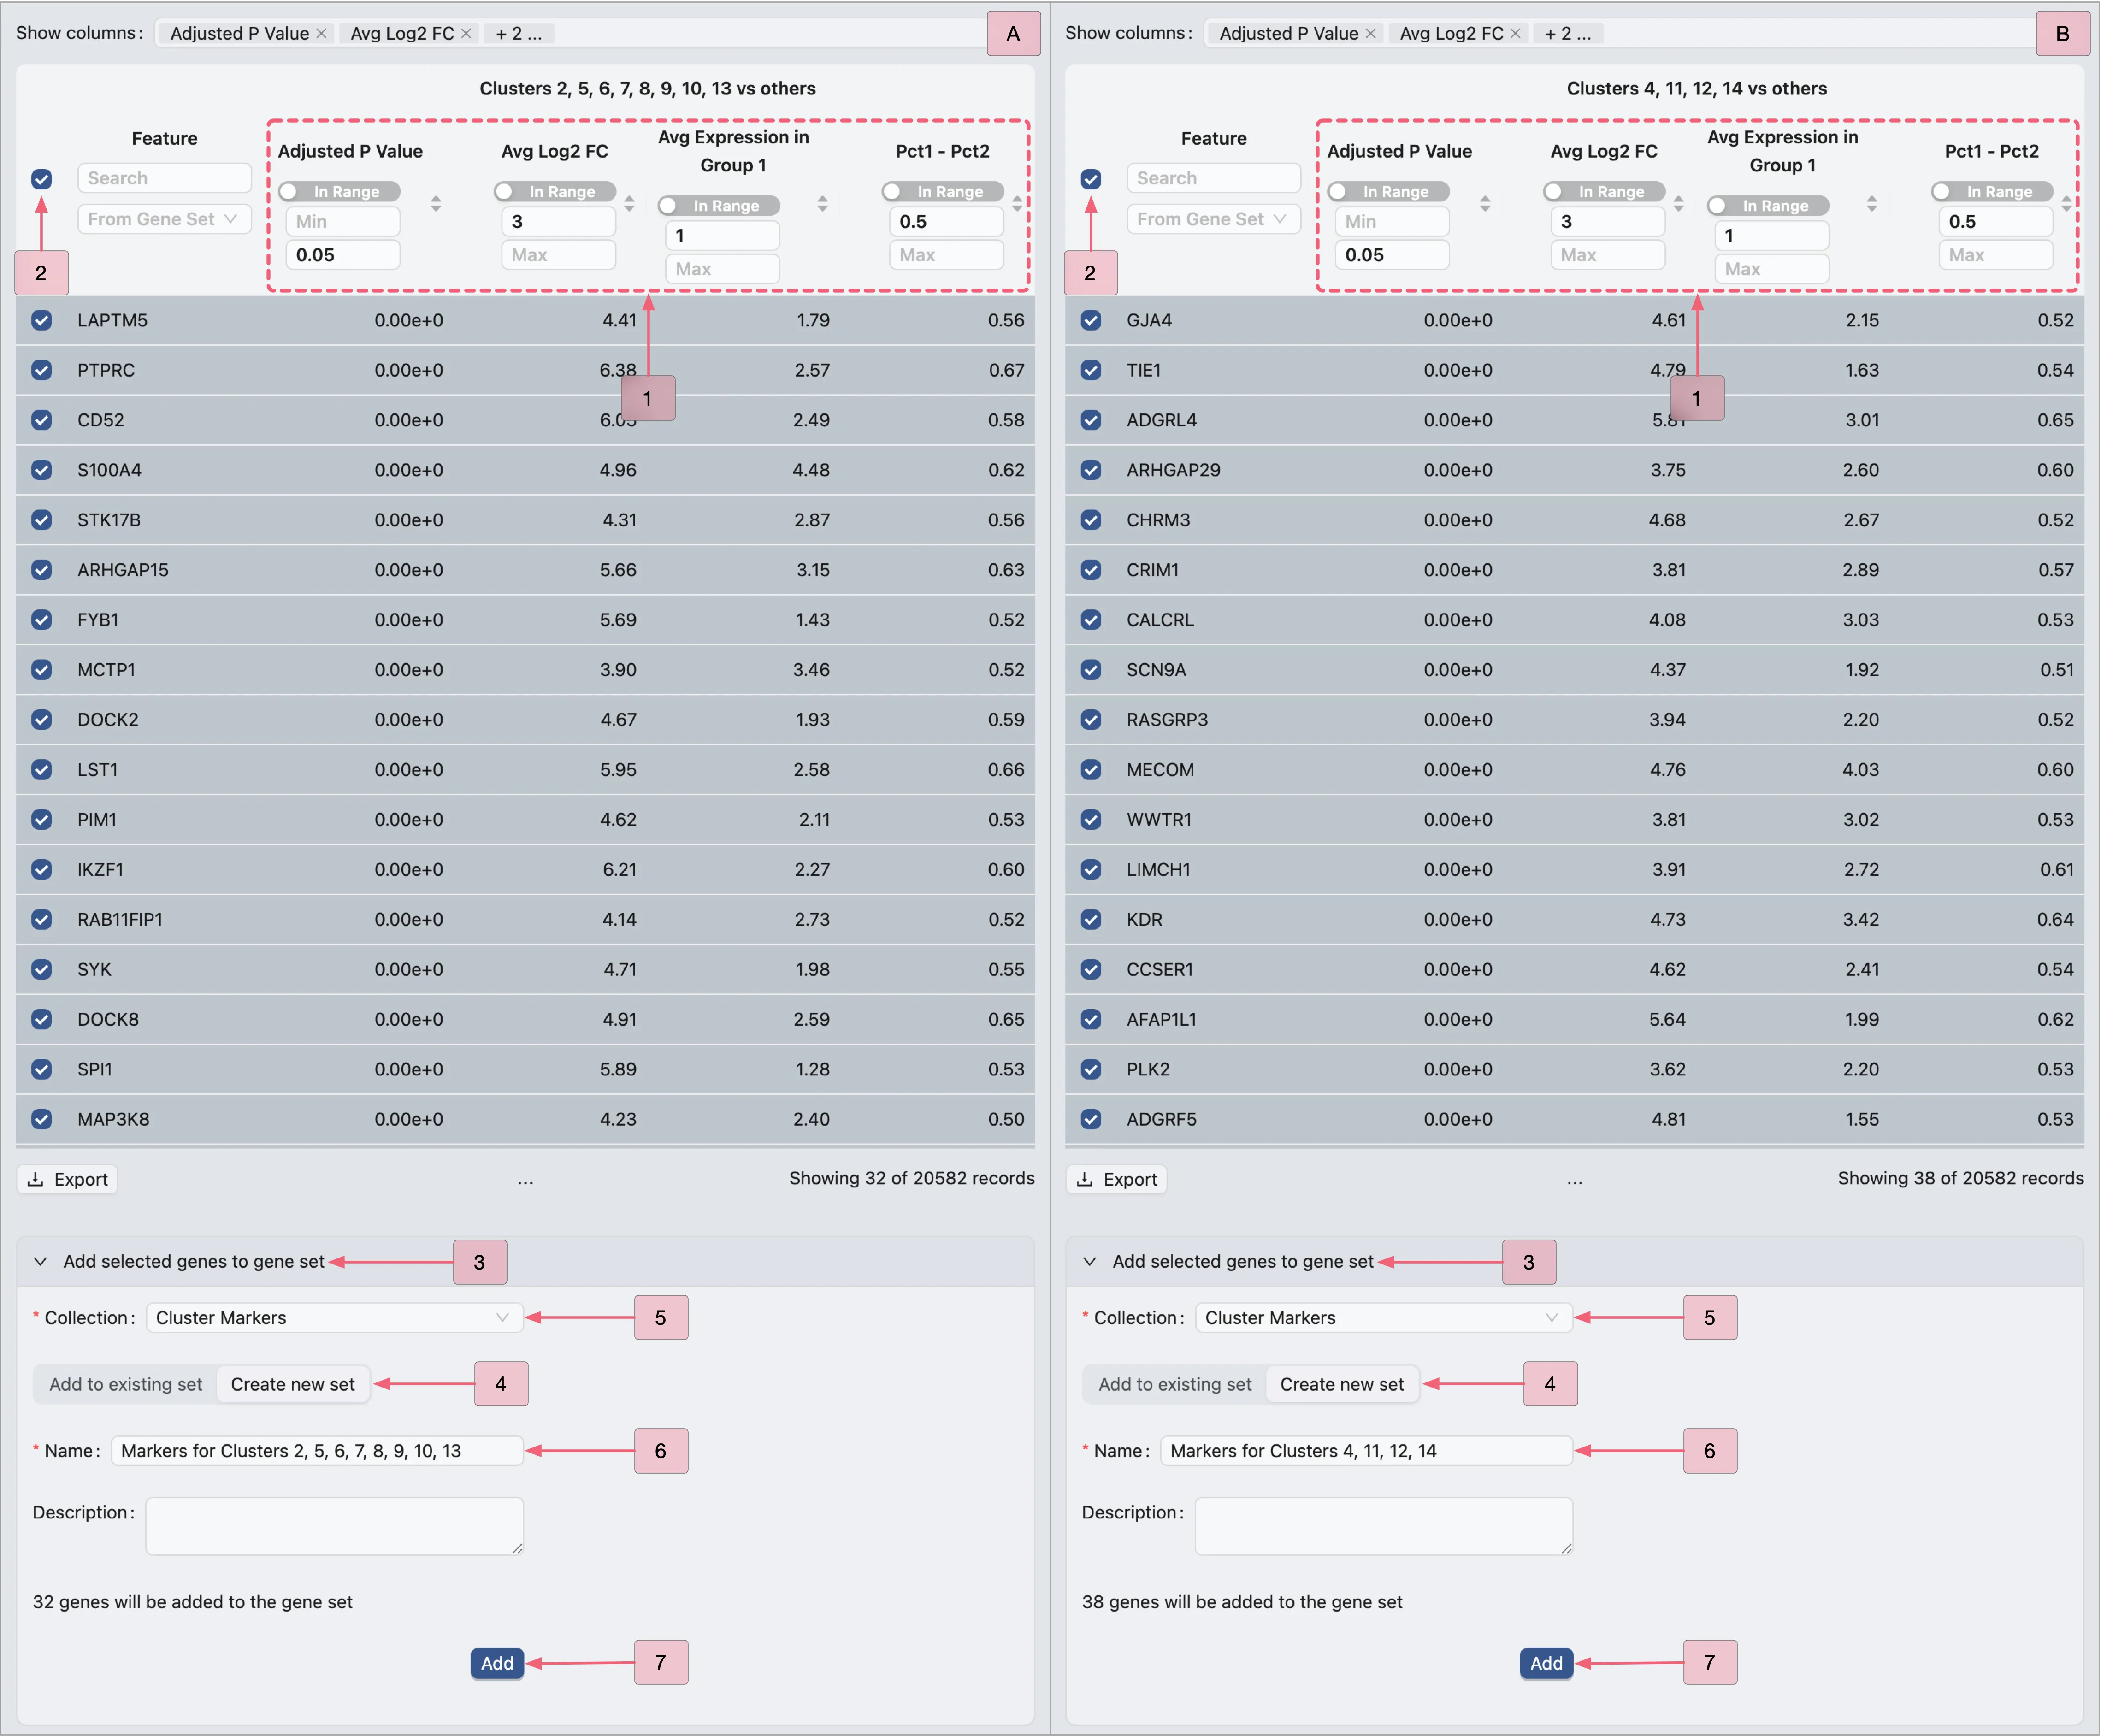
To identify marker genes for the first analysis Cluster 1, 3, 15 vs others, filter the Results table using the following criteria:
Log fold change > 3
Adjusted p-value < 0.05
Average expression > 1
Pct1 - Pct2 > 0.5
Follow these steps to filter the table results:
In the
Show columnssection, enable the following columns for filtering:Adjusted p-value: The adjusted p-value of differential expression.
Avg Log2 Fc: The average log2 fold change.
Avg Expression in Group 1: The gene's average expression in Group 1.
Pct1 - Pct2: The difference in expression percentage (Group 1 vs Group 2).
Apply these filters in the Results table:
Adjusted P Value: Min:
[empty]| Max:0.05.Avg Log2 FC: Min:
3| Max:[empty].Avg Expression in Group 1: Min:
1| Max:[empty].Pct1 - Pct2: Min:
0.5| Max:[empty].
Next, we will add the filtered genes to the Cluster Markers gene set collection, following these steps:
In the Results table, check the box next to the
Featurecolumn to select all filtered genes.Click the
Add selected genes to gene setbutton to expand the form.Click the
Create new setbutton switch to the creation form.Select
Cluster Markersin the Collection field (where the new set will be added).Enter
Cluster 1 markersin the Name field as the gene set identifier.Finally, click the
Addbutton to create the set and include the genes.
Note: If the Cluster Markers collection does not exist, follow the instructions in Create a new Gene Set Collection before proceeding.
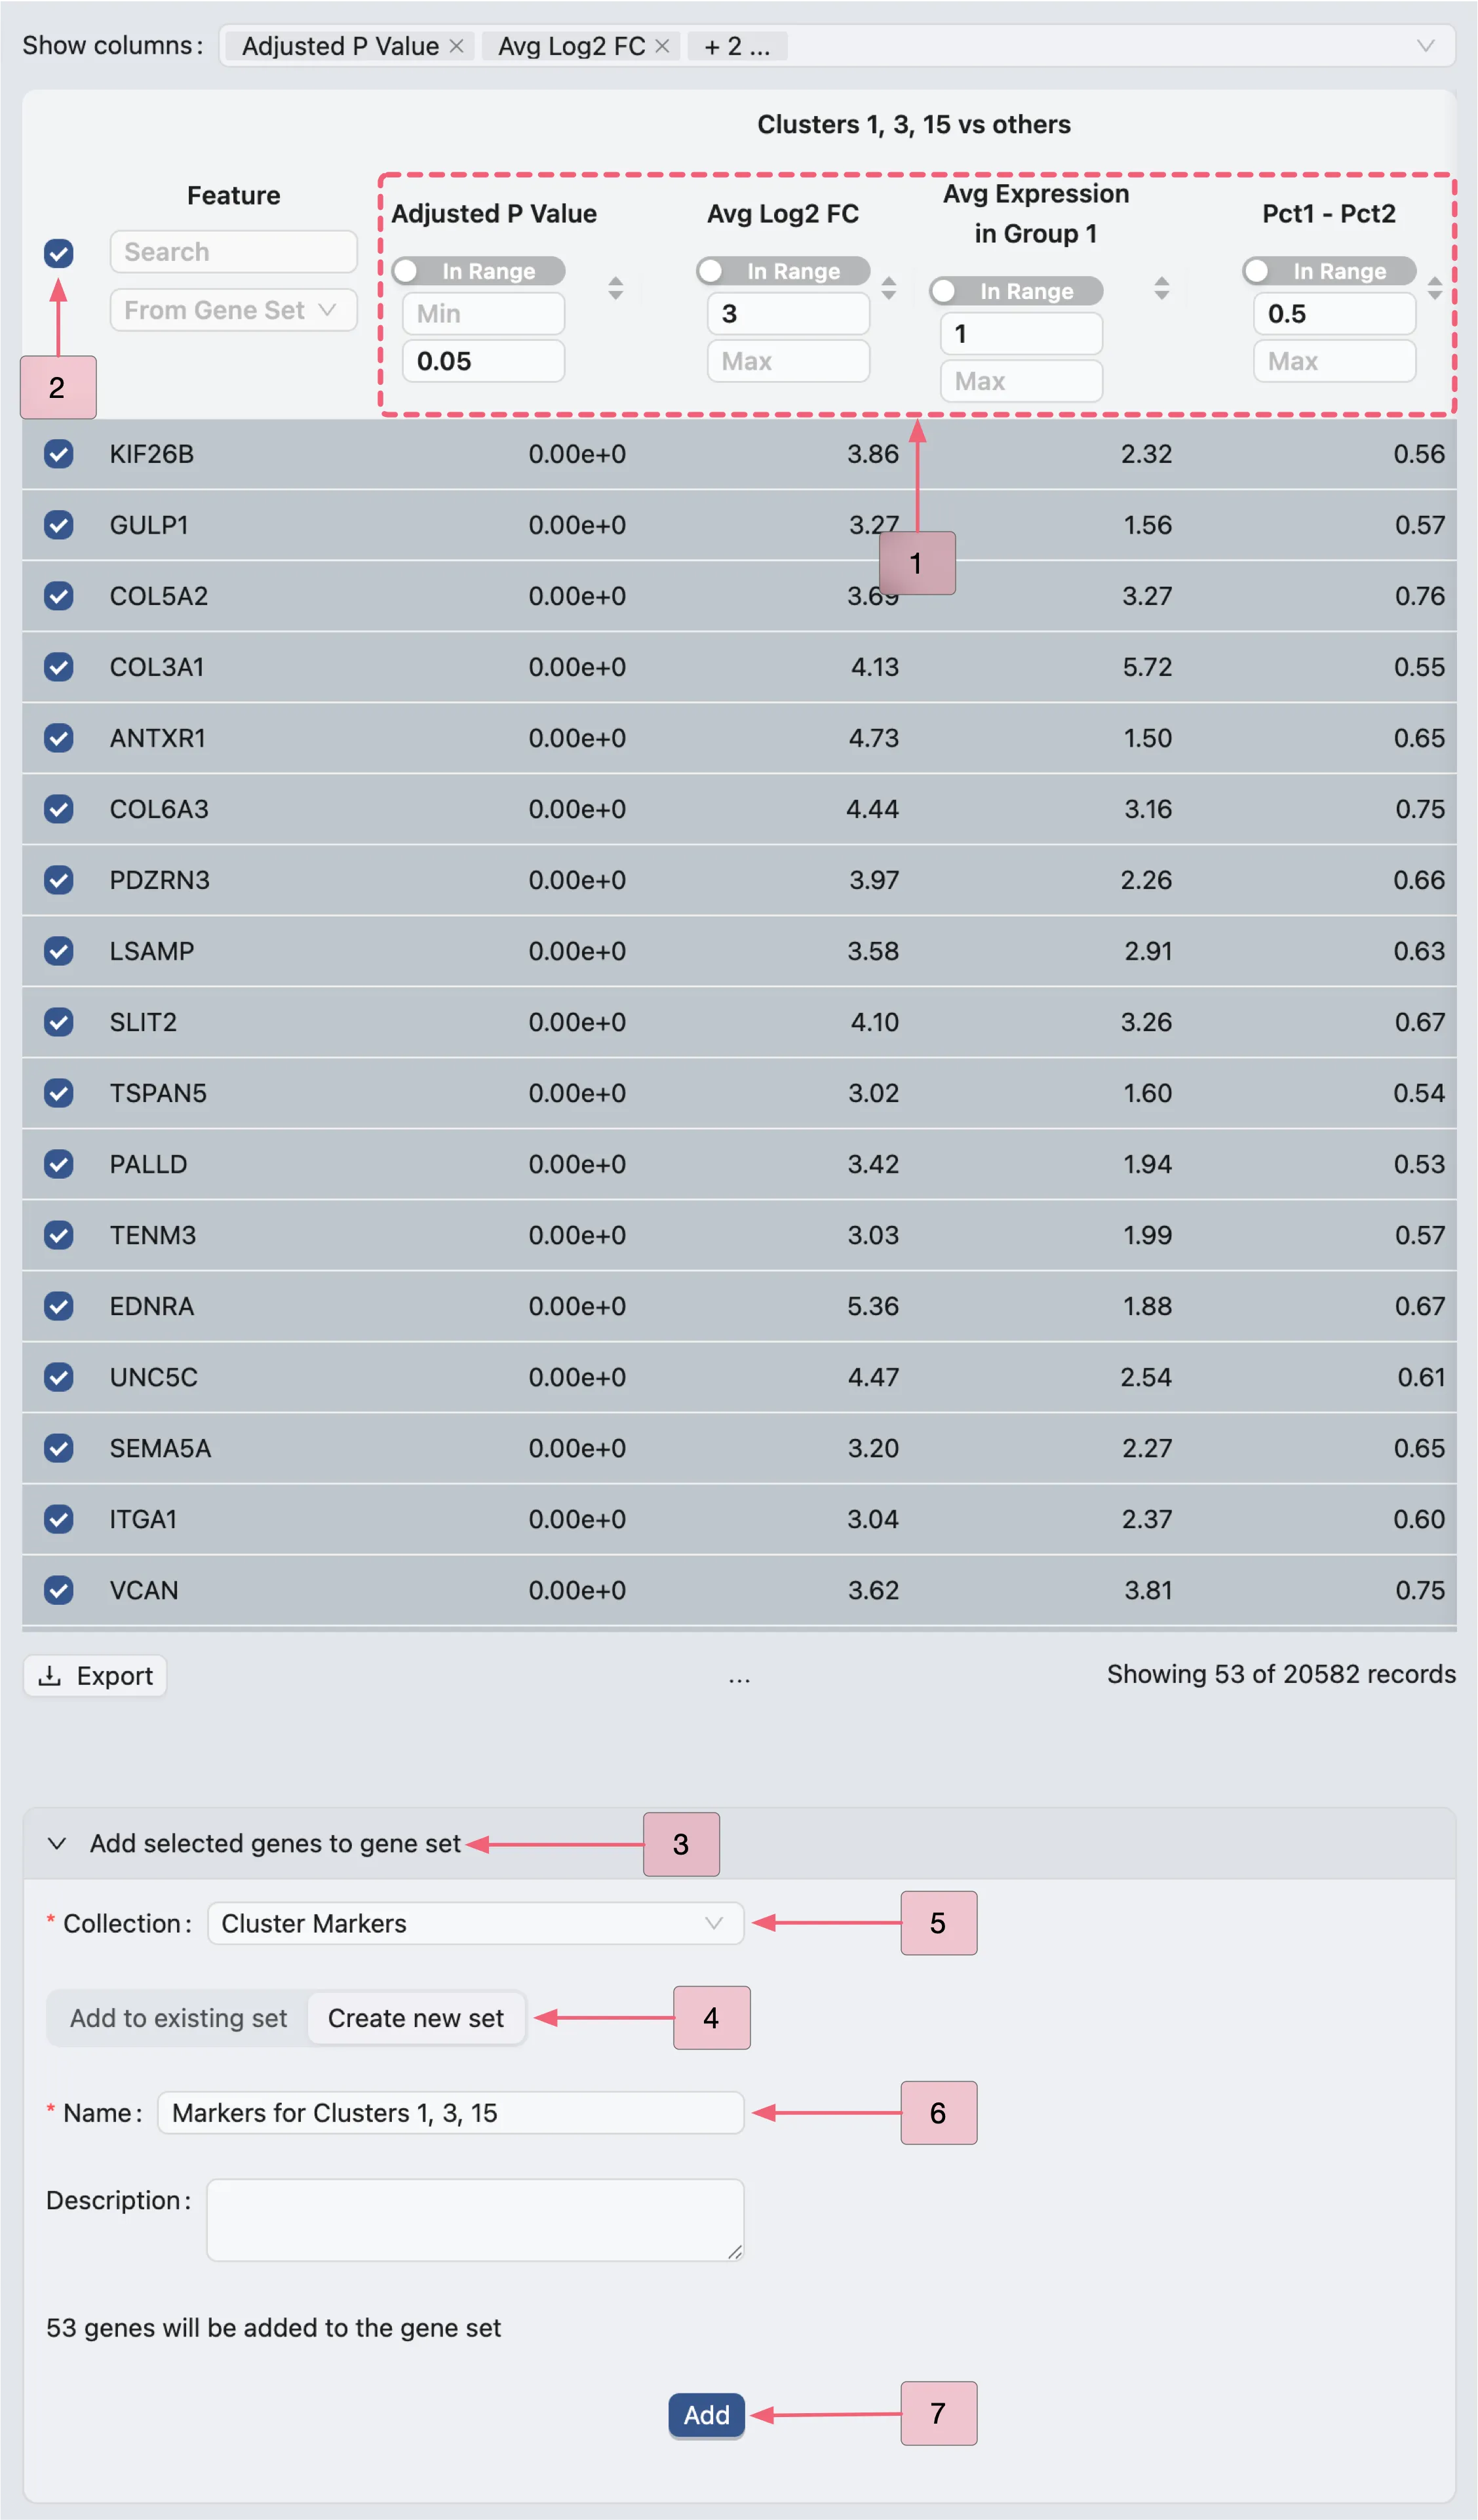
Apply the same criteria and steps to create gene sets for other analyses:
A: Identify marker genes for the second analysis (Clusters 2, 5, 6, 7, 8, 9, 10, 13 vs others).
B: Identify marker genes for the third analysis (Clusters 4, 11, 12, 14 vs others).
Extract DE genes using multiple DE results
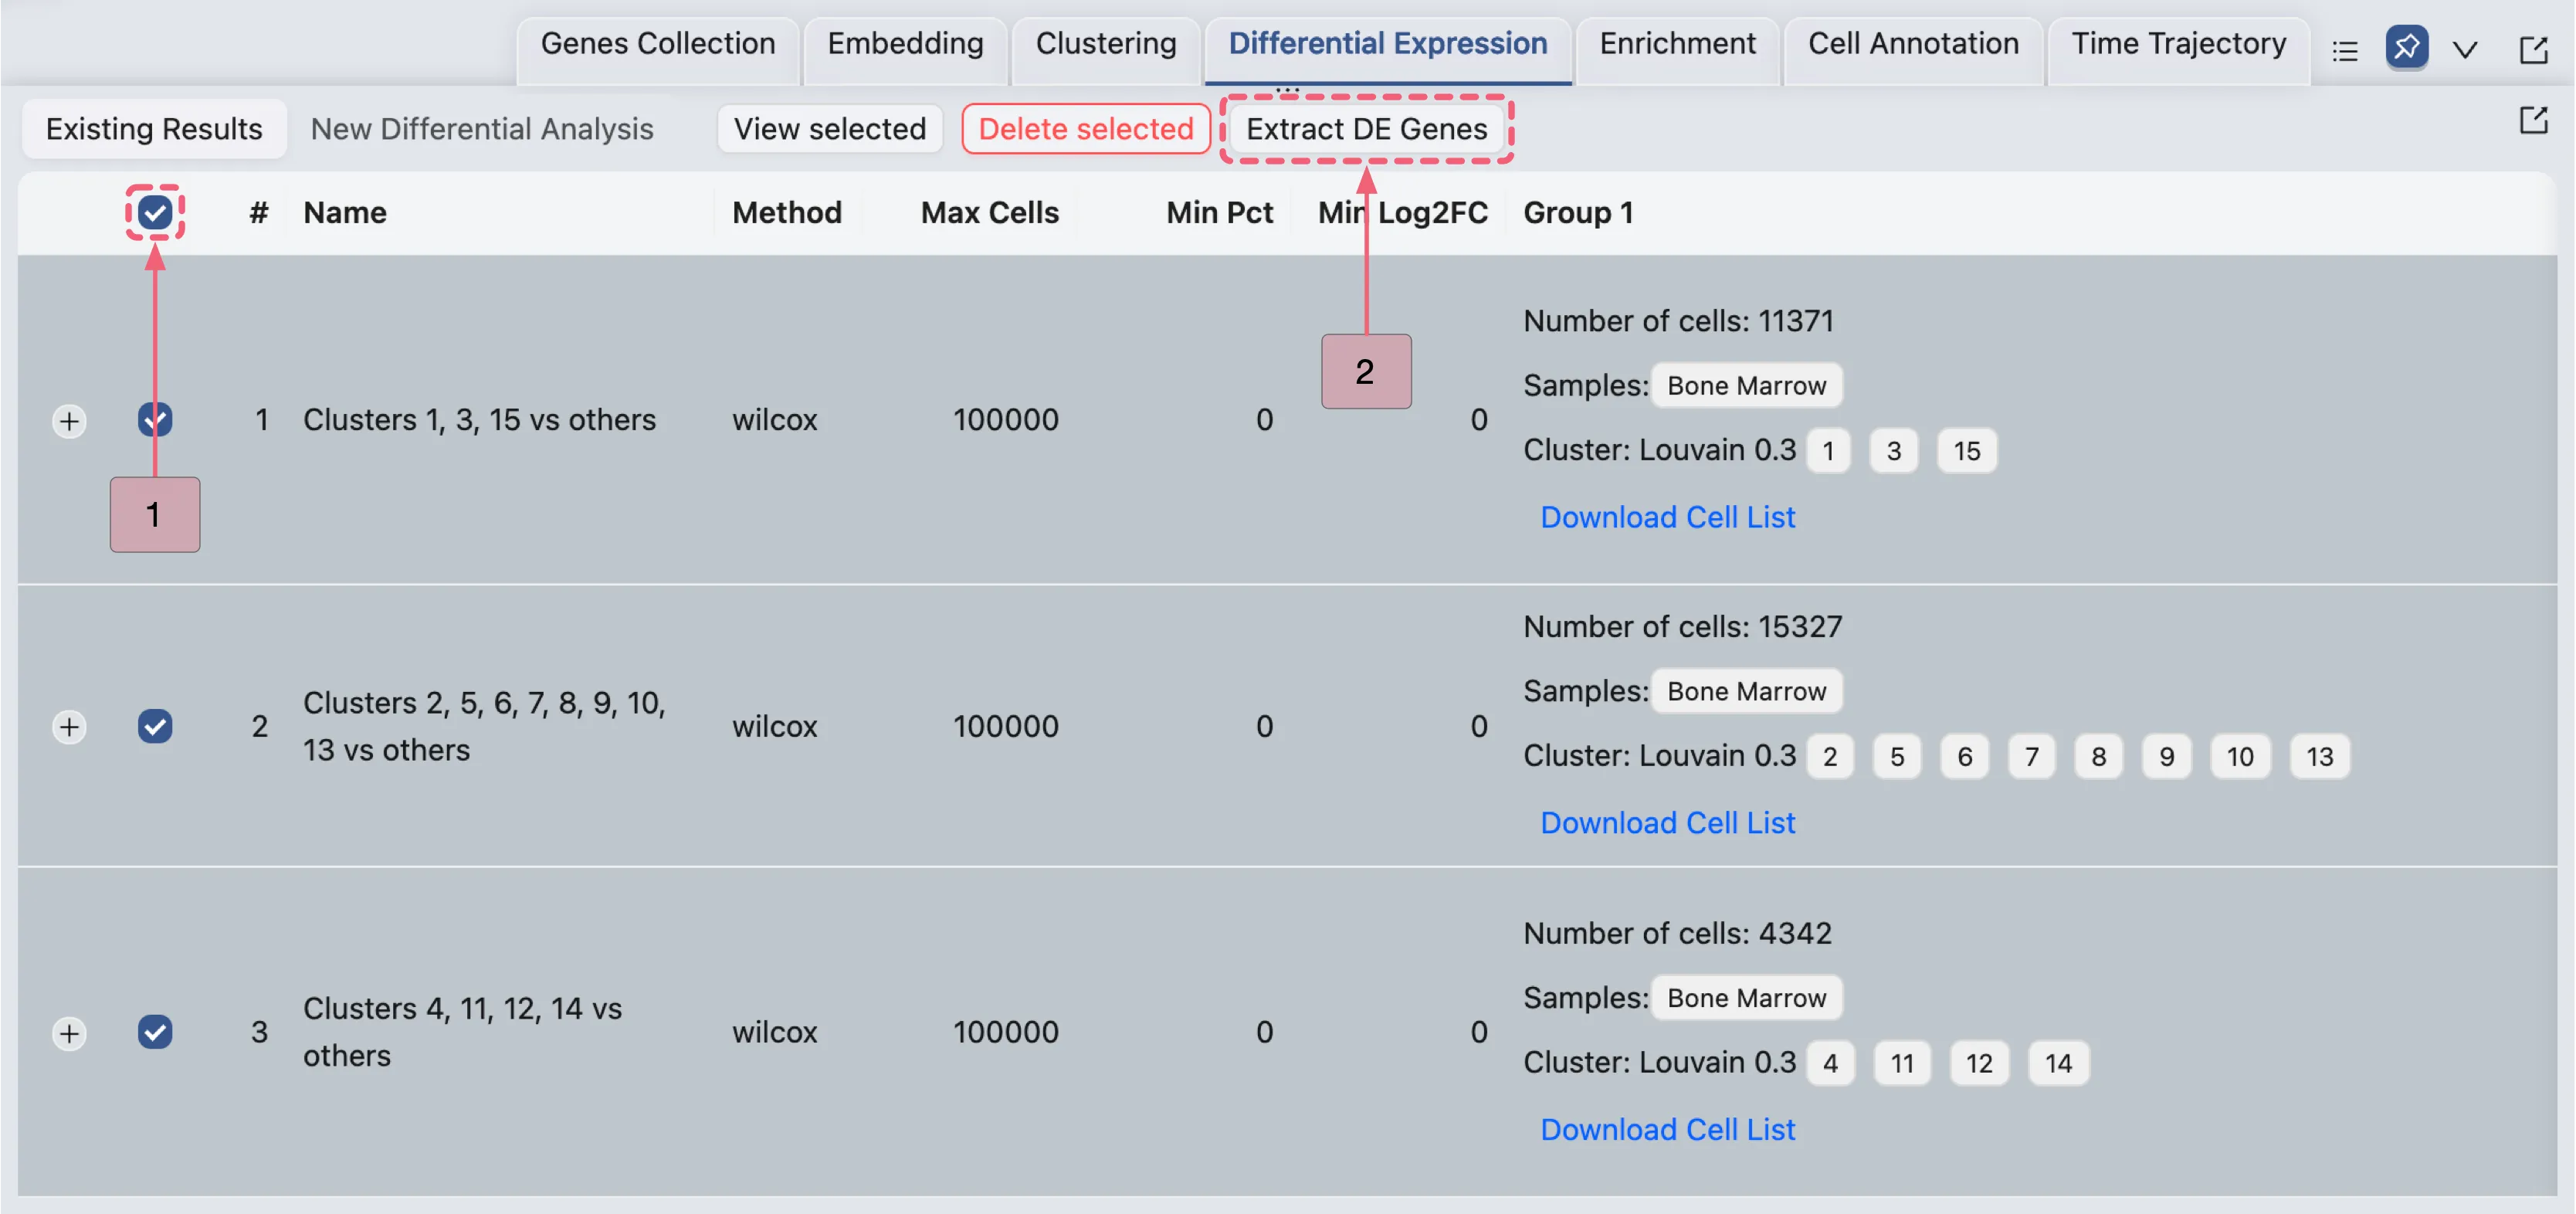
In the Differential Expression Table, follow these steps:
Select all three analyses simultaneously by checking the box in the table header (next to the
#symbol).Click the
Extract DE genesbutton to open the Extracting DE Genes panel in a popup window.
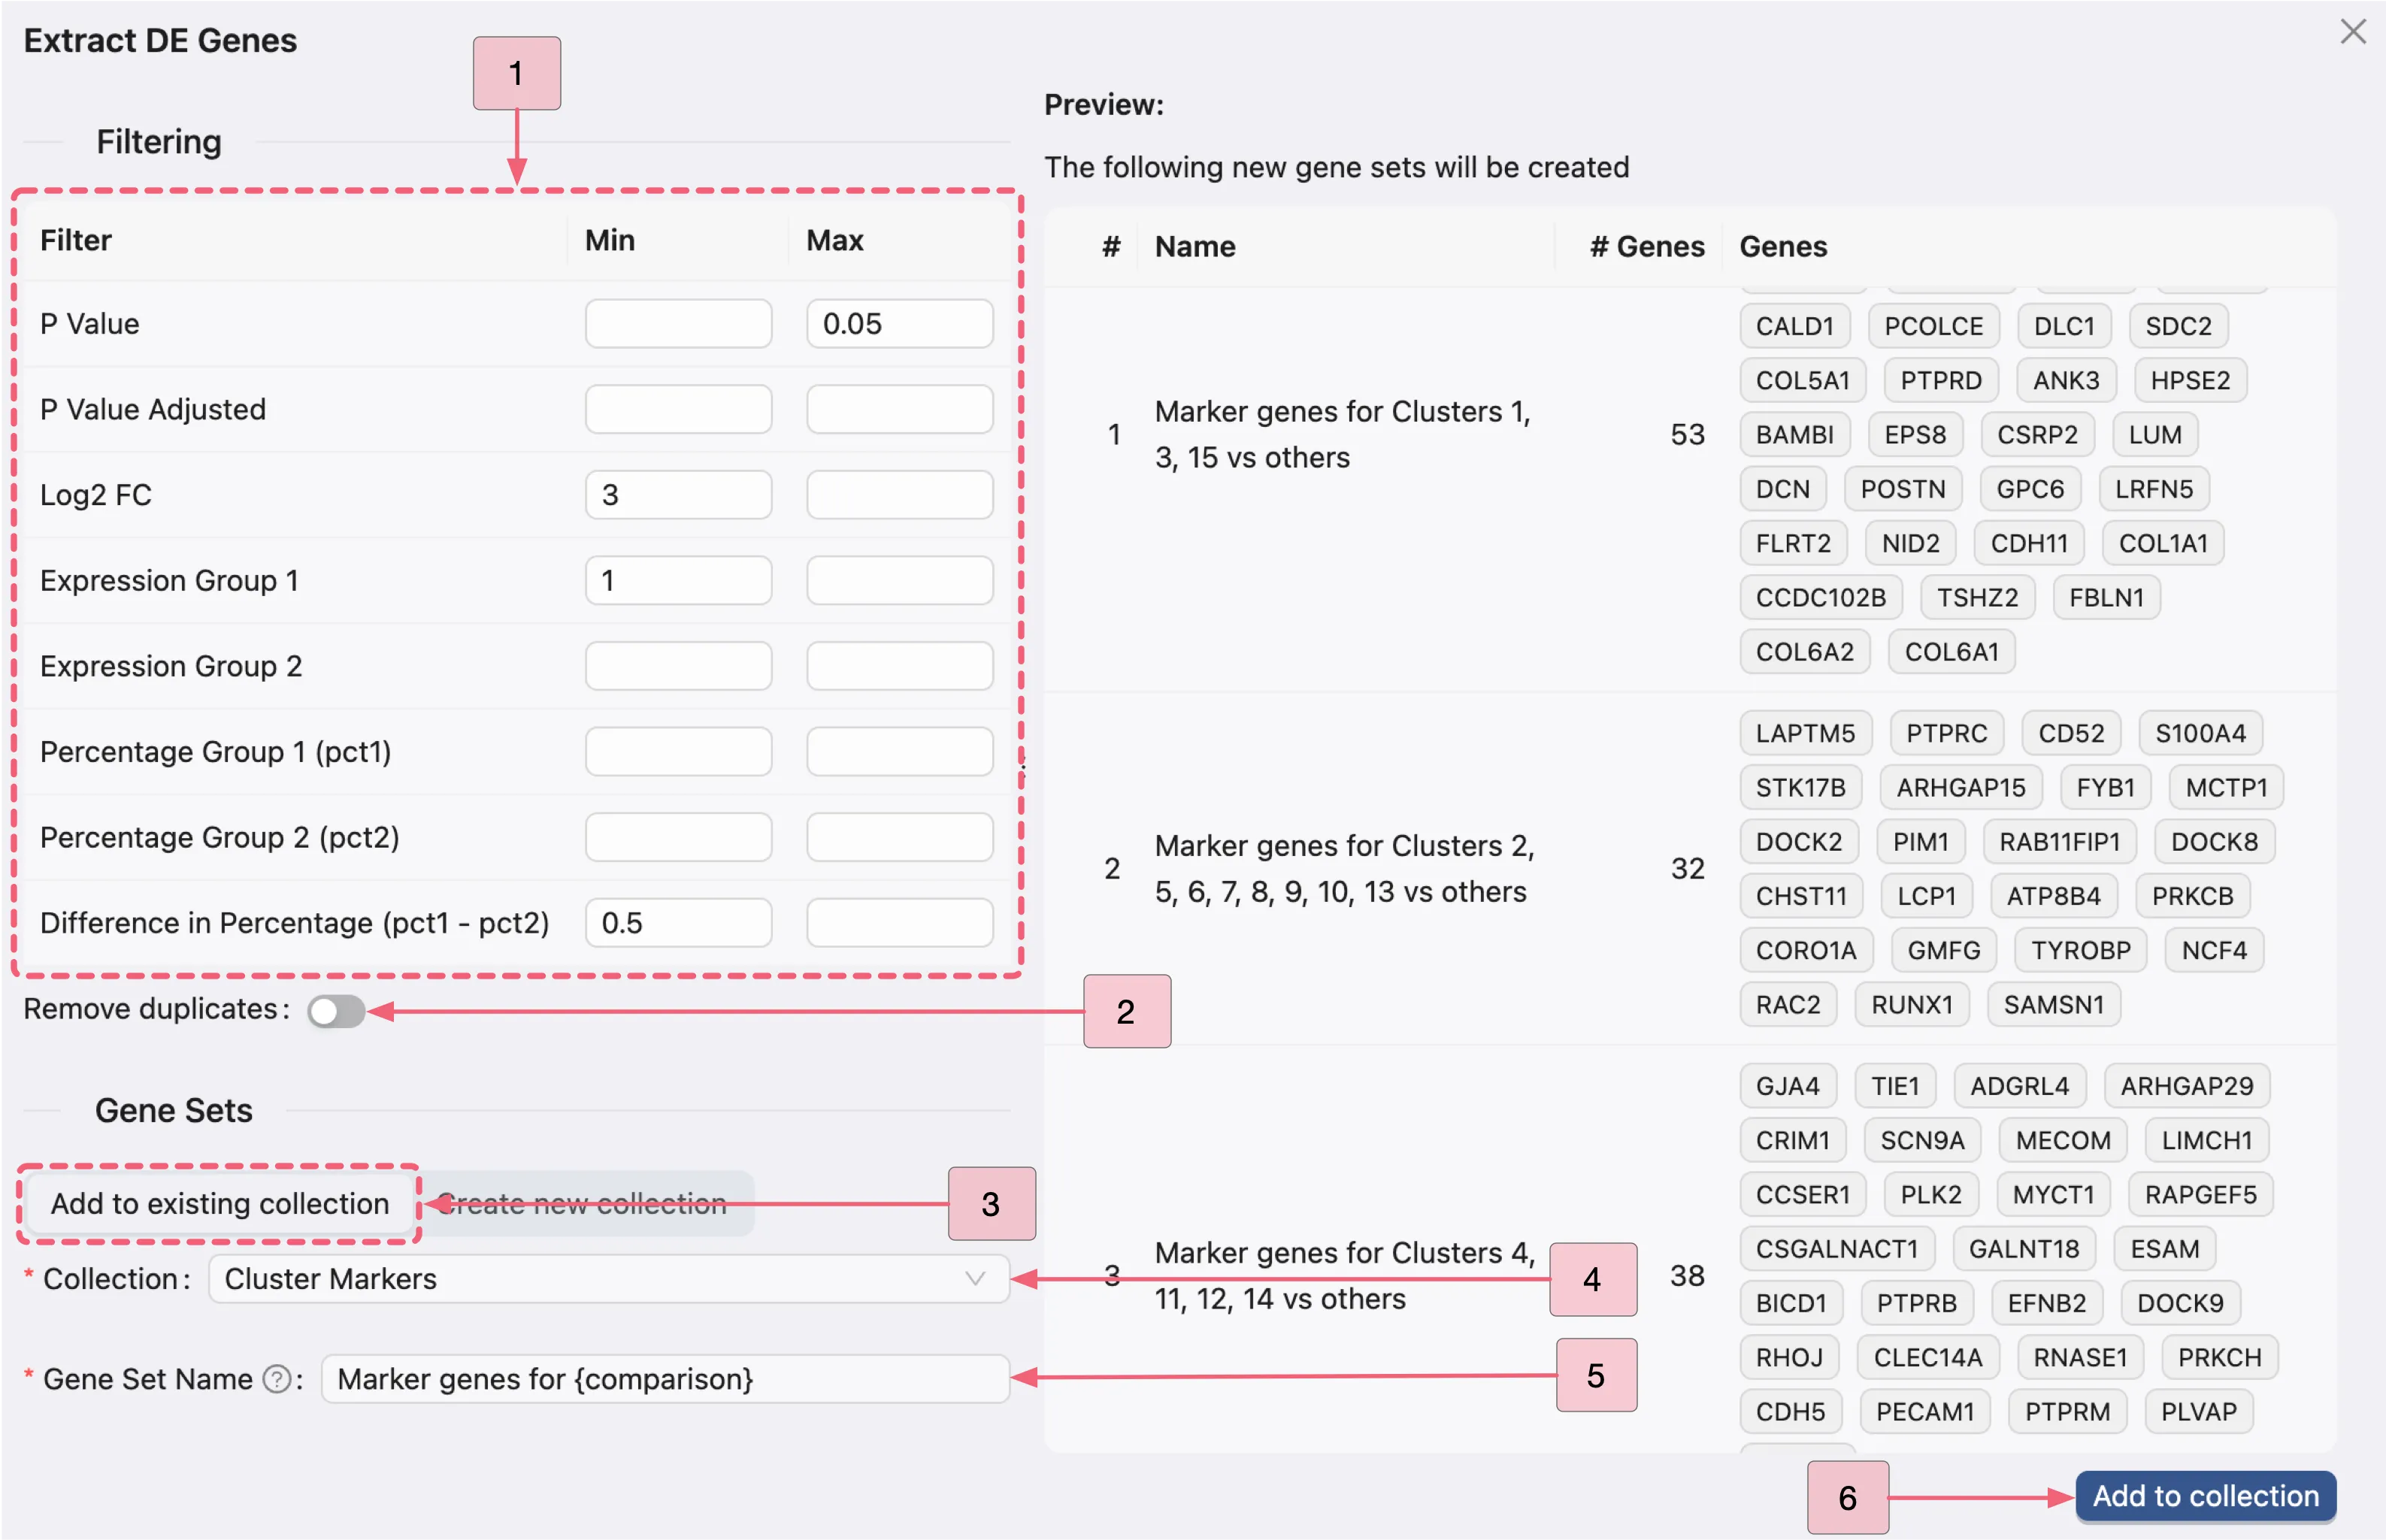
On the Extract DE Genes panel, apply the same filtering criteria to all three analyses. Follow these steps to extract DE genes from the three analyses:
In the filtering section, set the following criteria:
P Value Adjusted: Min:
[empty]- Max:0.05.Log2 FC: Min:
3- Max:[empty].Expression Group 1: Min:
1- Max:[empty].Difference in Percentage (pct1 - pct2): Min:
0.5- Max:[empty].
Remove dupplicates: Whether to eliminate duplicate markers from each gene set. In this case, disable this option to retain as many markers as possible for cell type identification.Click the
Add to existing collectionbutton, then configure:Collection: Select
Cluster Markersas the target collectionGene Set Name: Use
Marker genes for {comparison}as the naming pattern. Note:{comparison}will be automatically replaced with the analysis names.
Click the
Add to collectionbutton to finalize and store the filtered gene sets.
Visualize expression patterns
In this section, we will visualize the expression patterns of the marker genes in each group to verify that the selected genes are consistently and uniquely expressed in the target populations.
Follow these steps to visualize the expression patterns of the marker genes in each group:
Click the
Featuresbutton to switch to the Features tab in the Left Sidebar.Ensure the settings in the Top Toolbar are configured as follows:
Visualization embedding:
pca- Specifies the embedding used for visualization.Normalization method:
LogNorm- Normalization applied to the data.Plot Type:
Scatter- Type of chart displayed.Plot blending mode:
Separate- Blending mode for visualization.
Under Gene set collections in the left sidebar, locate the collection named
Cluster Markers.Click the
 button next to the following labels:
Markers for Clusters 1, 3, 15Markers for Clusters 2, 5, 6, 7, 8, 9, 10, 13Markers for Clusters 4, 11, 12, 14
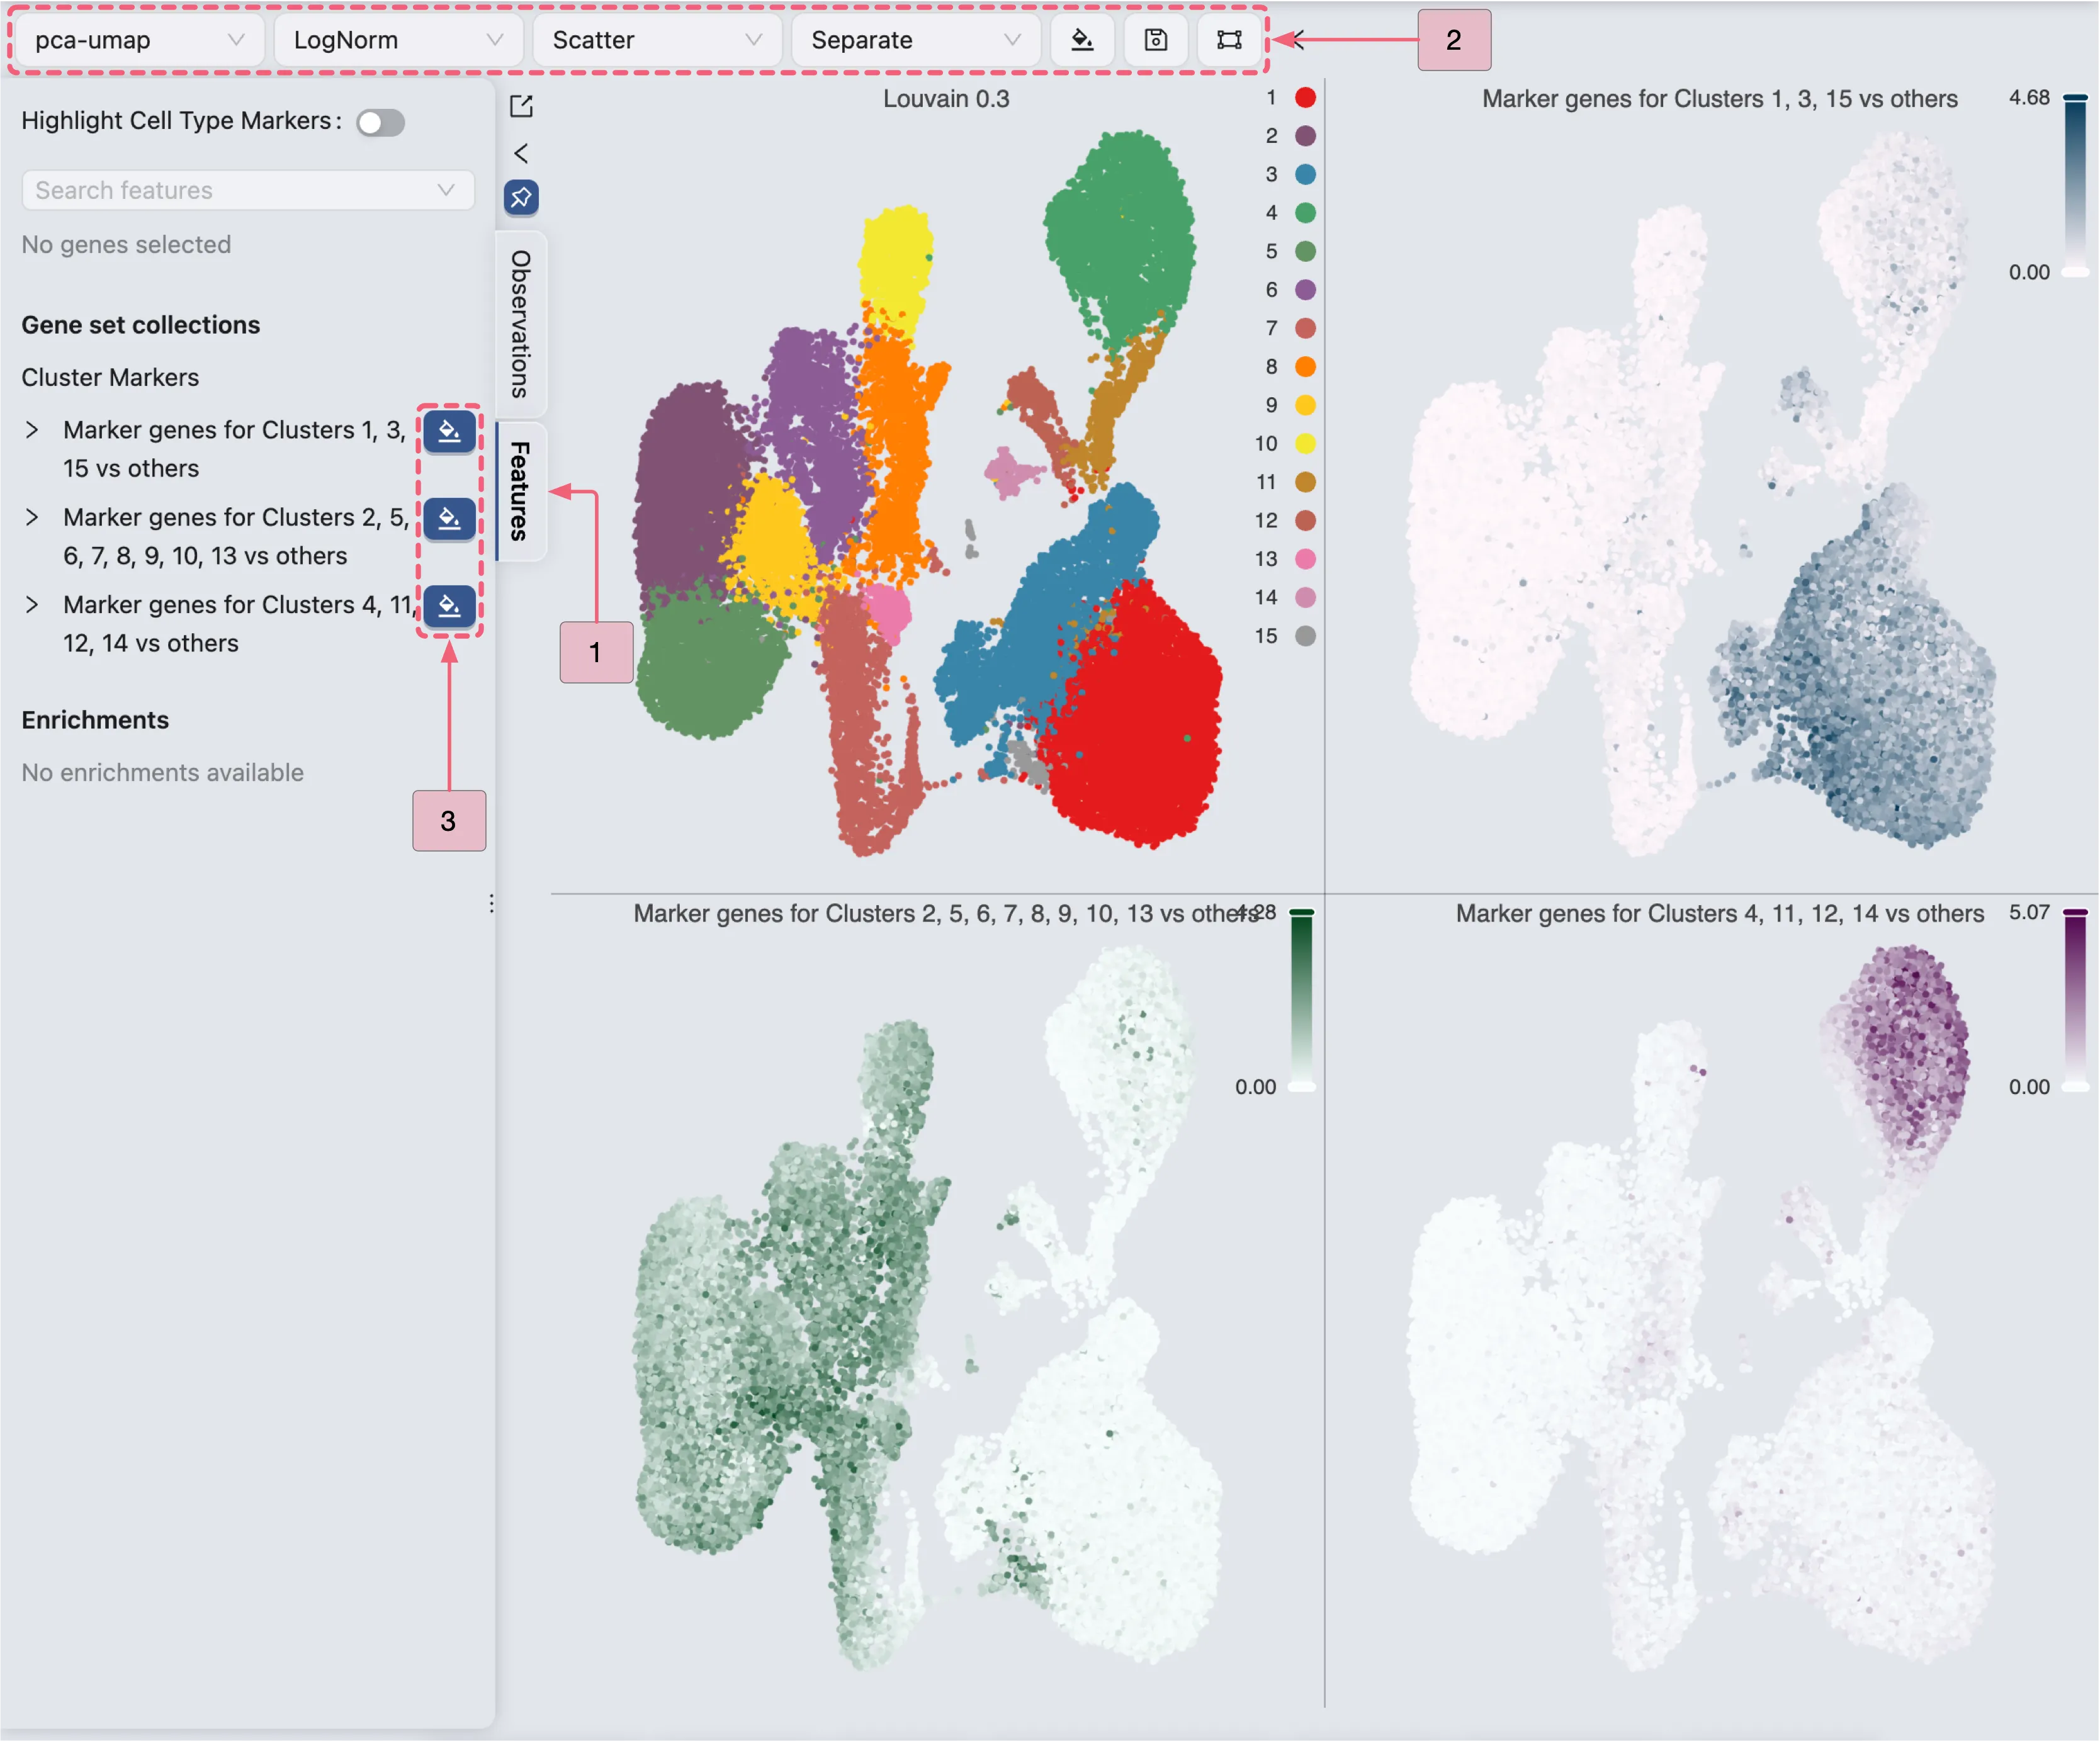
By visualizing the expression patterns of the markers in each group, we observe that:
The marker genes for population I (Clusters 1, 3, 15) exhibit high expression within this population and have negligible expression in other populations. Therefore, we are confident that population I represent a single cell type.
Likewise, marker genes associated with population II (Clusters 2, 5, 6, 7, 8, 9, 10, 13) are predominantly expressed within this second population, showing minimal expression outside of it. Thus, it is highly likely that population II also consists of a single cell type.
Given that the marker genes for population III (Clusters 4, 11, 12, 14) are highly expressed primarily in cluster 4 and show minimal to no expression in clusters 11, 12, and 14, cluster 4 likely represents a unique cell type. This clear distinction highlights the importance of conducting differential expression (DE) analyses to further elucidate the specific characteristics of this population.
Exploring substructure within population III
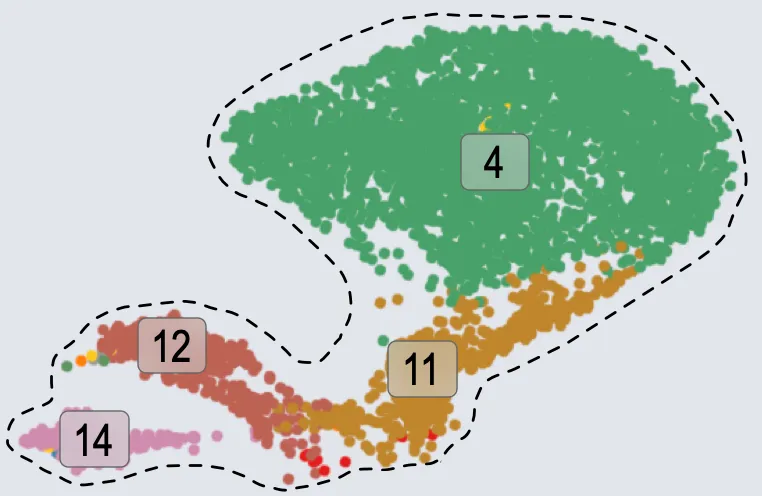
To further understand the gene expression within population III, we will perform differential expression analyses in each of its clusters.
Perform Differential Expression Analyses for Cluster 4, 11, 12, and 14
CytoAnalyst allows you to efficiently run differential expression analyses for multiple clusters simultaneously. Follow these steps to achieve this:
Click the
Differential Expressiontab in the Bottom Drawer.Click the
New Differential Expressionbutton to access the creation form.Select the
By Clusteroption and configure the settings as follows:Name:
Cluster {cluster} vs. others- This placeholder will be replaced with the cluster number. (e.g.,Cluster 4 vs. others).Comparison mode:
With others- Specifies that each selected cluster will be compared against all other clusters.Select Clustering Result:
Louvain 0.3- Indicates which clustering result to use for the analysis.Select Clusters:
4,11,12, and14- Specifies the clusters to include in the analysis. This setup will launch four separate analyses at once, one for each selected cluster.Ensure that you have selected the
Bone Marrowsample in the Sample section on each group.Method:
Wilcoxon- Indicates the statistical method to be used for the analysis.Max Cells:
100000- Specifies the maximum number of cells to use for the analysis.Min Percent:
0- Indicates that only genes expressed in at least this percentage of cells will be included in the analysis. In this case, we include all genes.Log Fold Change:
0.0- Indicates that only genes with a log fold change greater than this value will be included in the results. In this case, we include all genes.CLick the
Submitbutton to create the analyses.
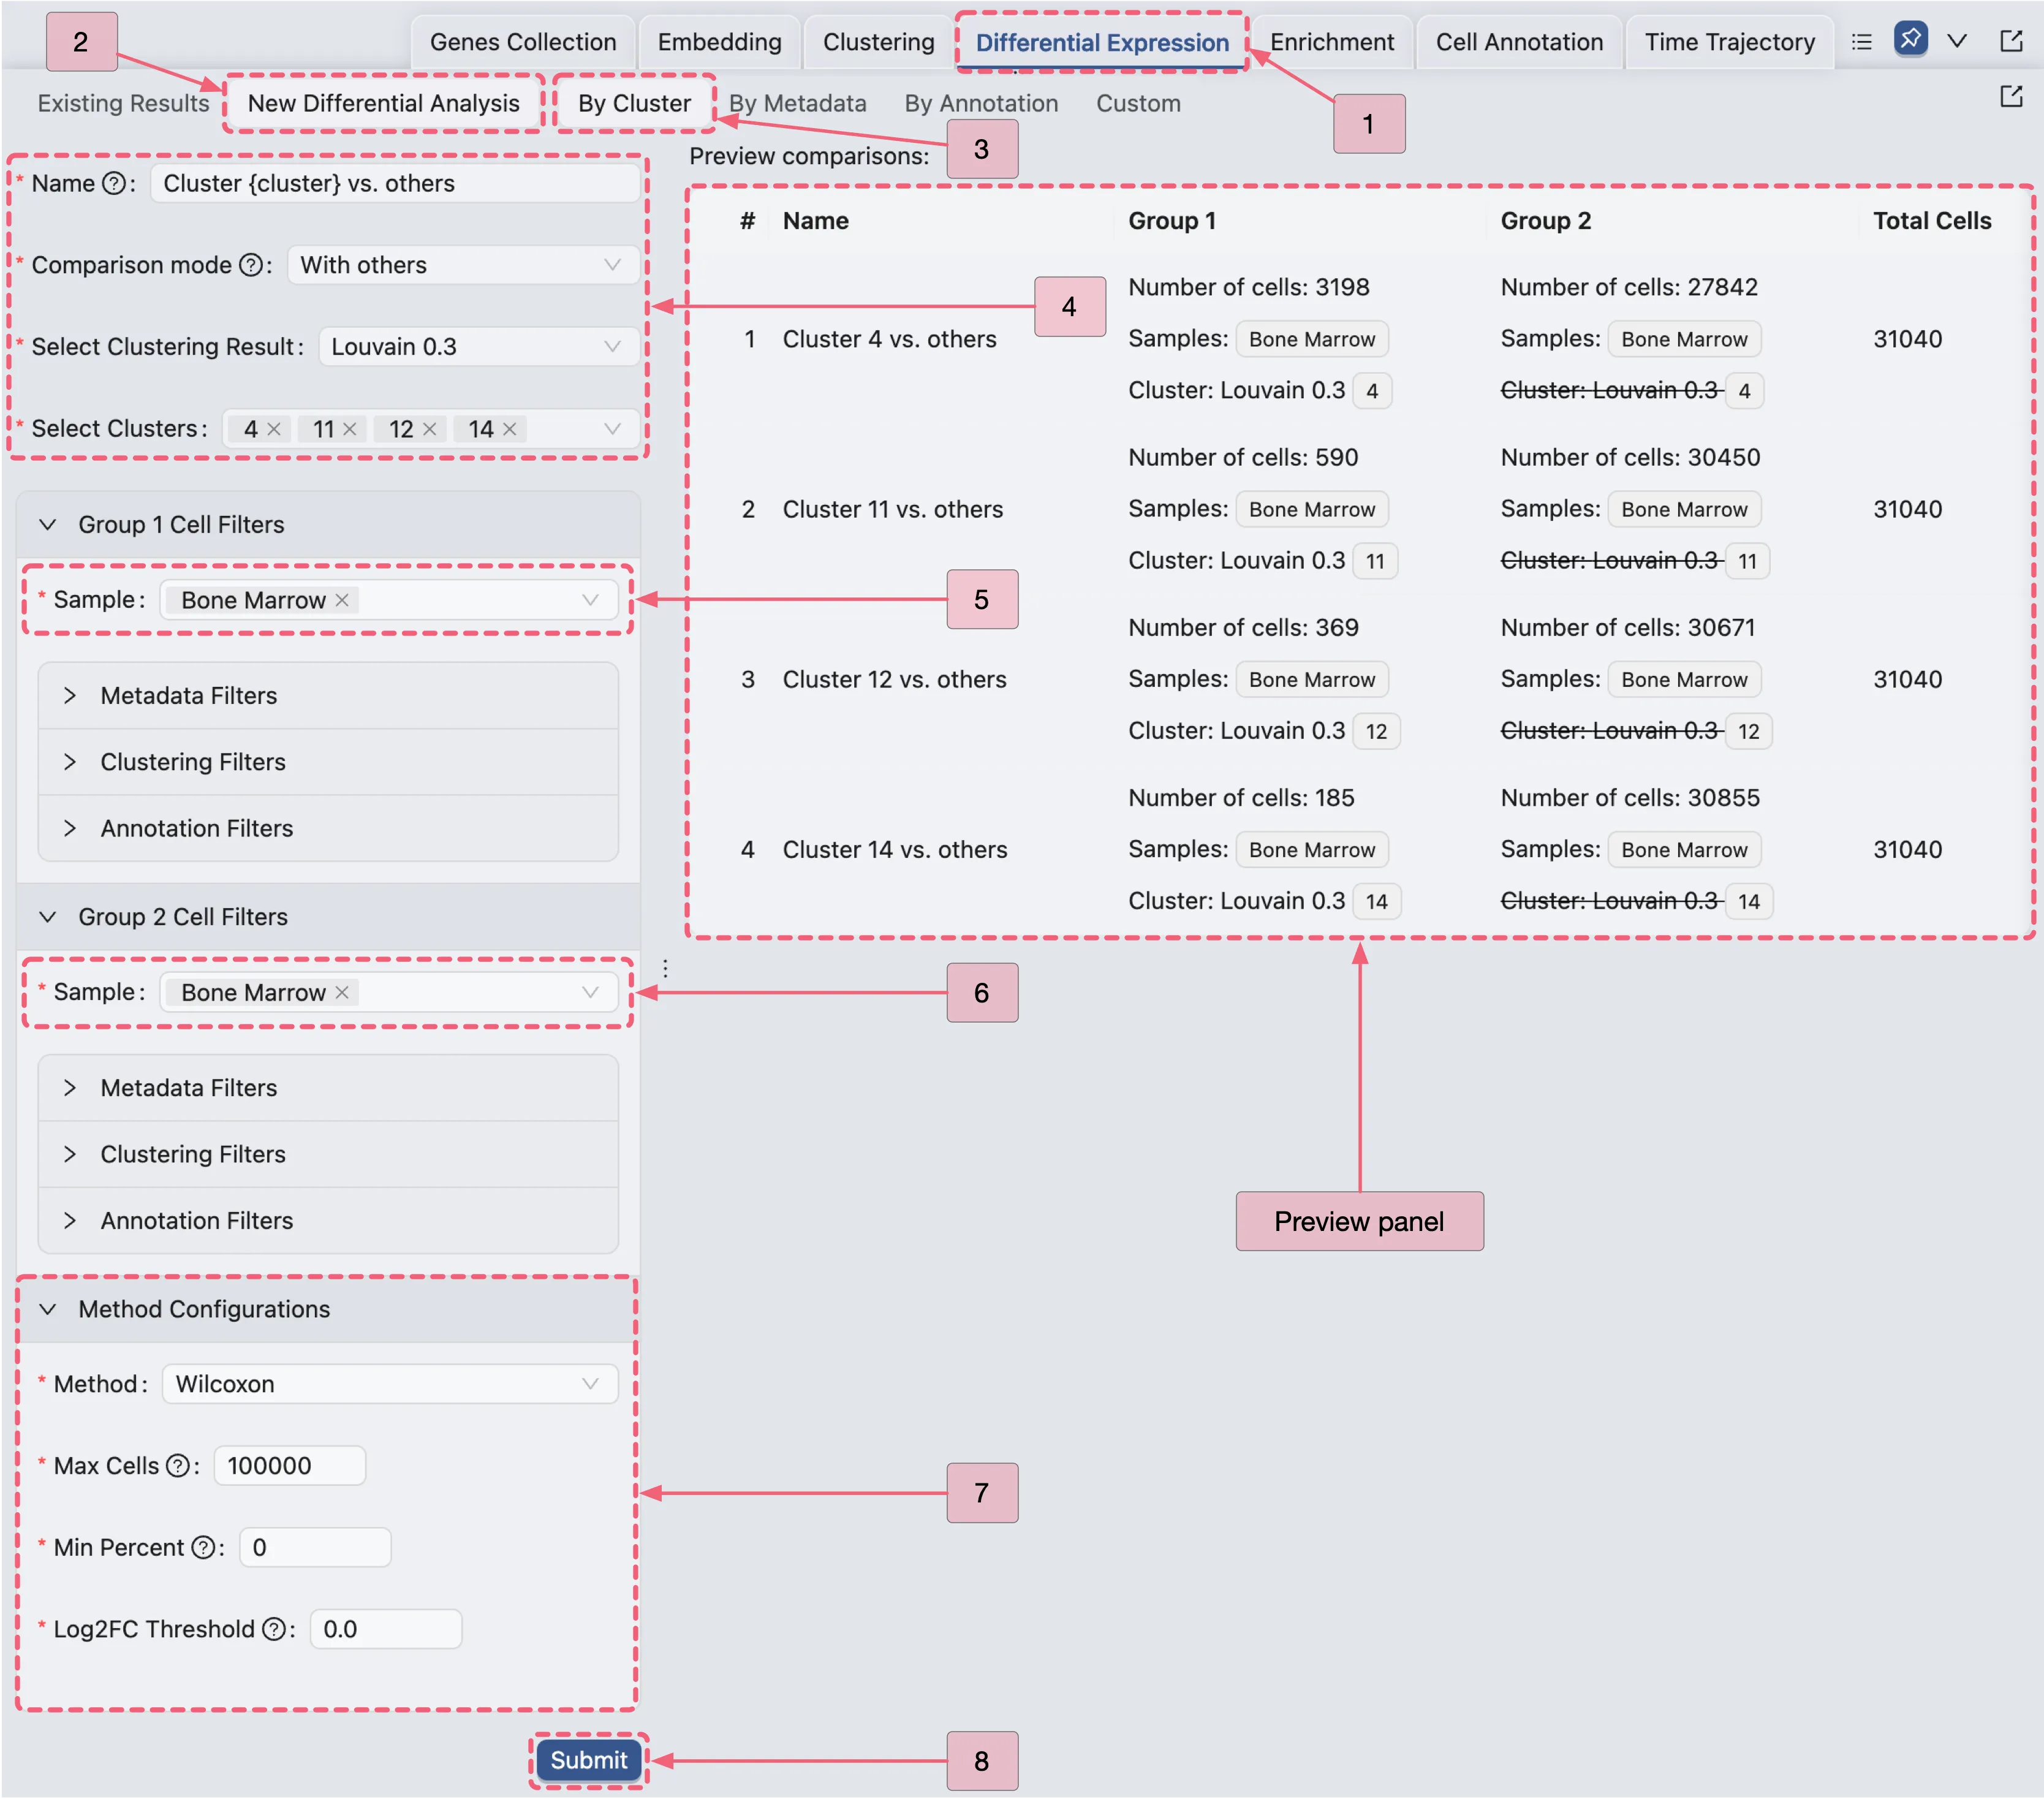
Identify Marker Genes for Cluster 4, 11, 12, and 14
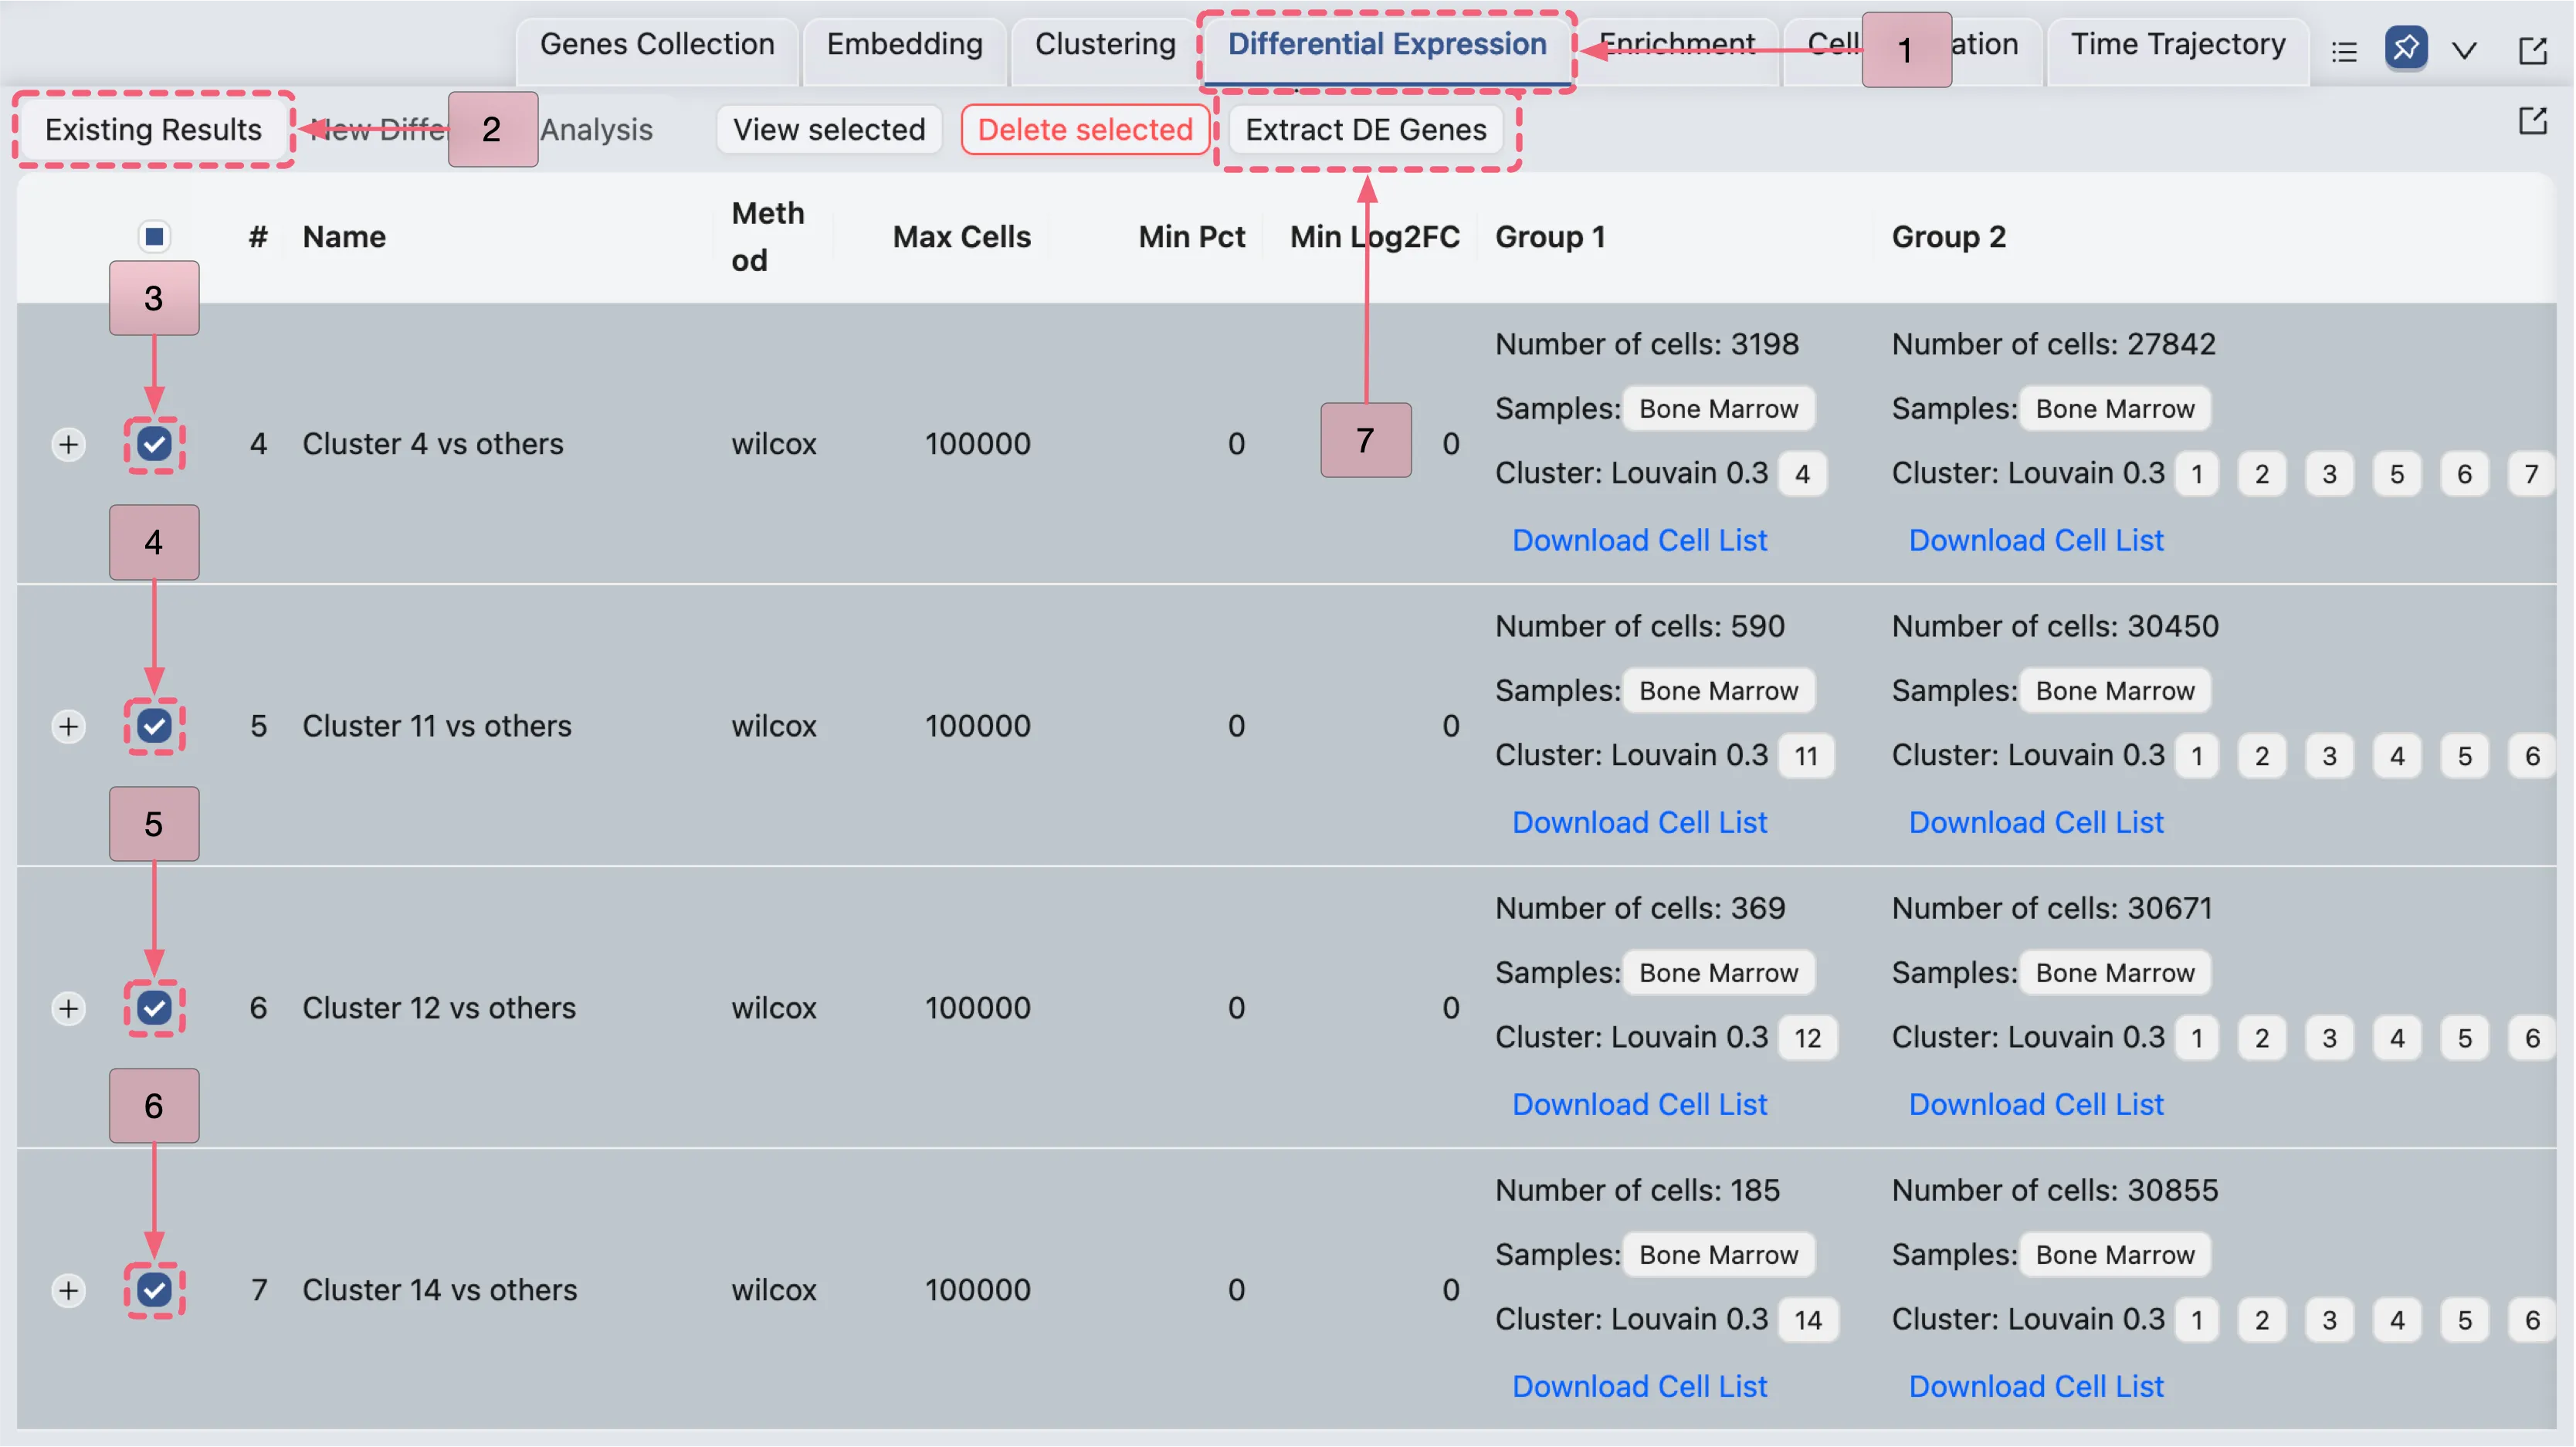
We will identify marker genes for clusters 4, 11, 12, and 14 by filtering their respective differential expression (DE) results and adding the filtered genes to the Cluster Markers collection. Follow these steps:
Navigate to the Differential Expression Table by clicking the
Existing Resultstab in the Bottom Drawer.Select the DE results for Cluster 4, Cluster 11, Cluster 12, and Cluster 14 by checking the corresponding boxes.
Open the
Extract DE Genespanel by clicking theExtract DE genesbutton.
On the Extract DE Genes panel, apply the same criteria used in the previous analyses to filter genes and add them to the Cluster Markers collection.
Note: Expect an error message when applying the same criteria from the previous analyses to the DE result of Cluster 11 vs others, as this is excluded from the filtering process. Please disregard this message and proceed with the filtering process; we will explain it further after filtering.
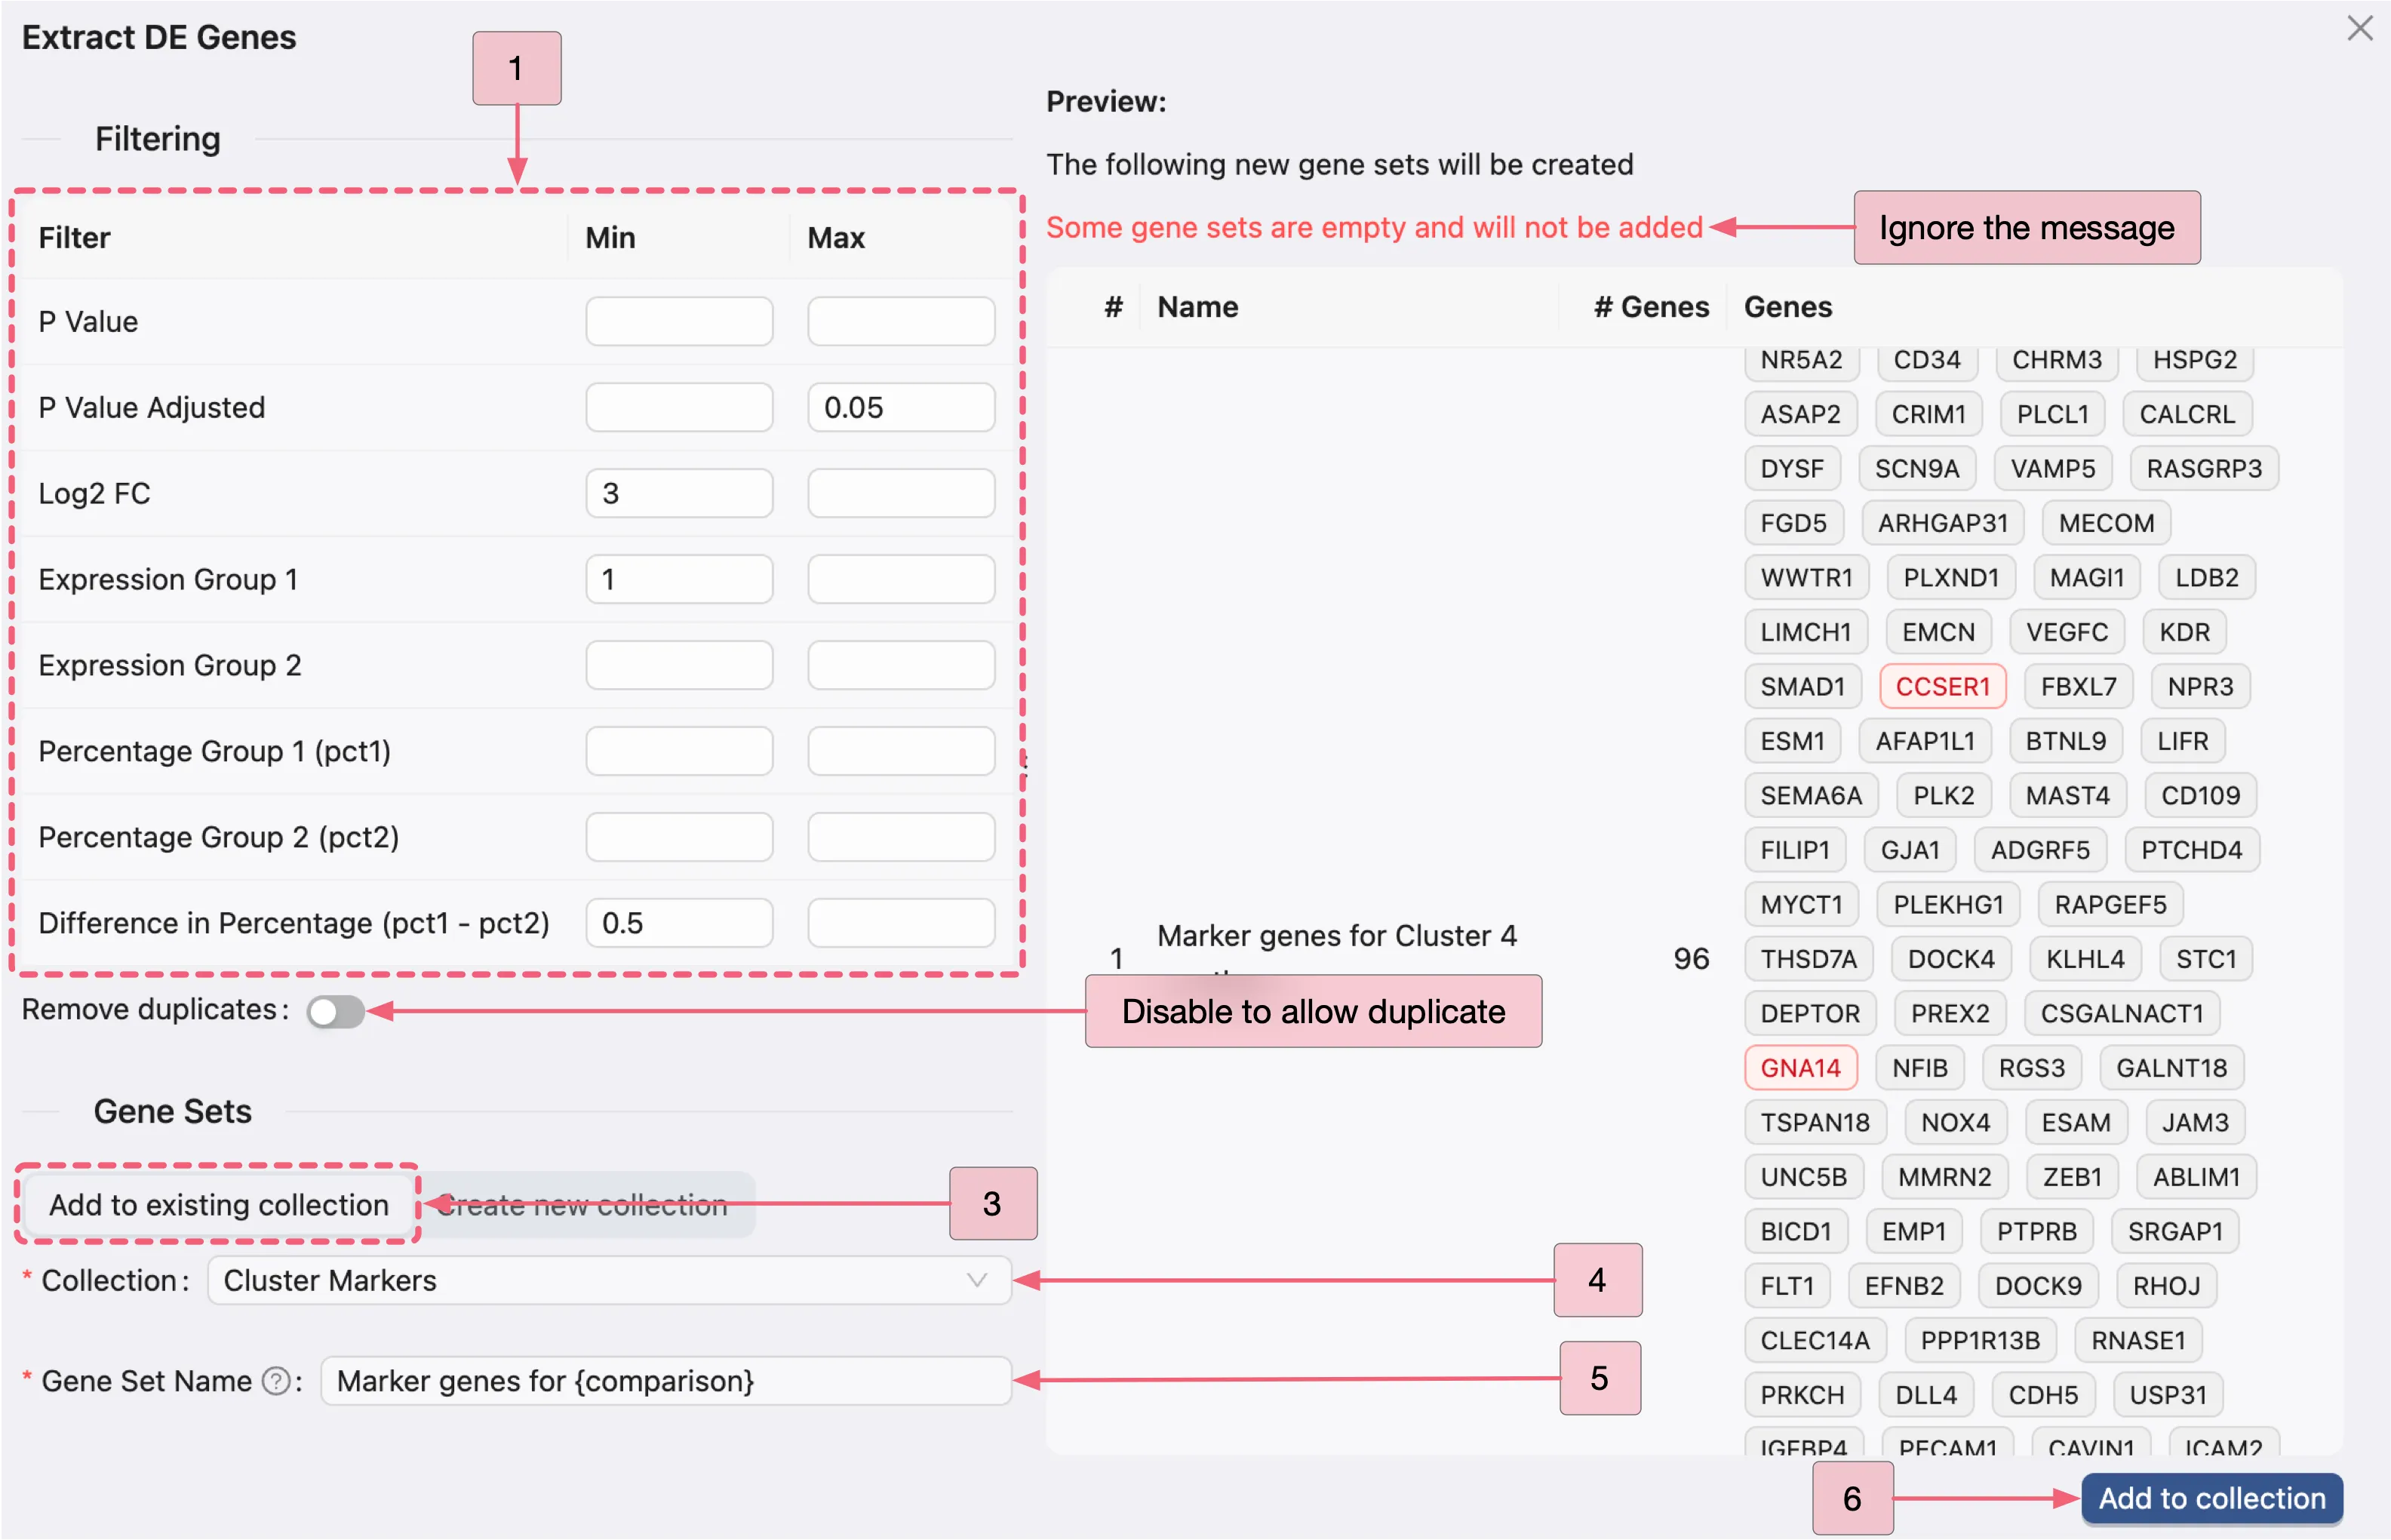
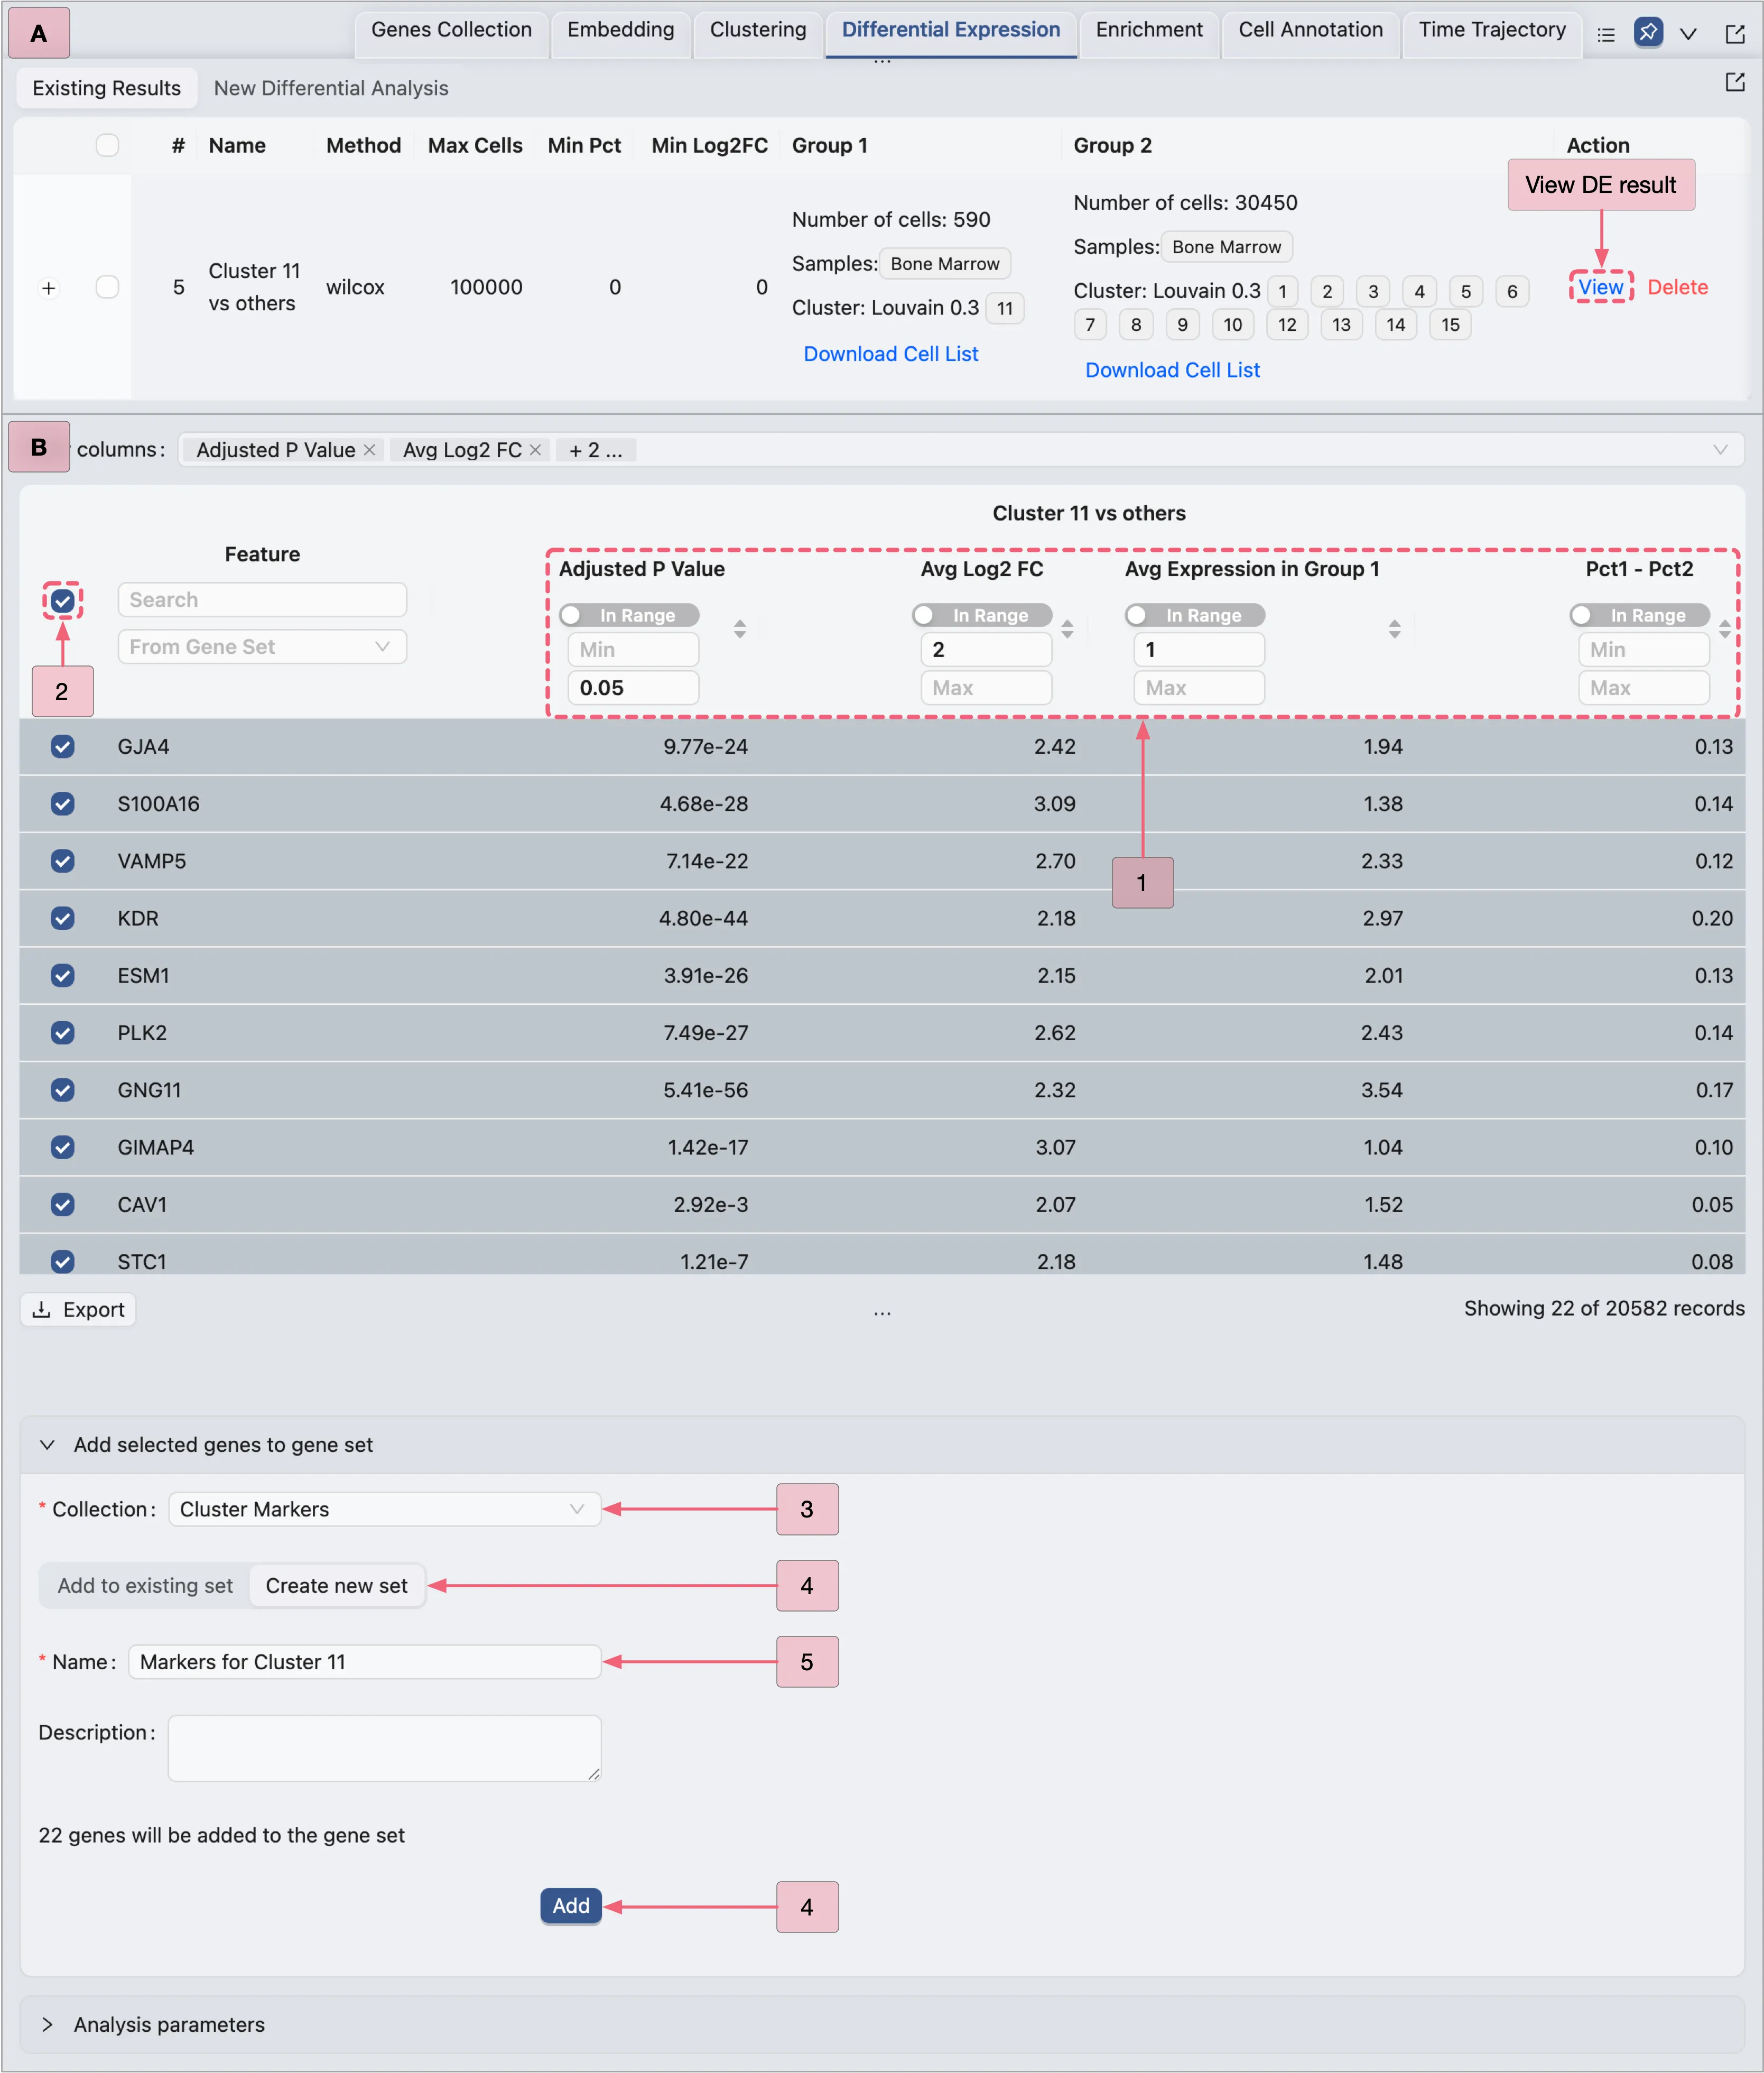
To capture subtle yet biologically meaningful marker genes in Cluster 11 vs others, which were previously missed by our strict original thresholds (Log2 FC ≥ 3), we relax the Log2 FC cutoff to ≥ 2 while maintaining statistical significance (adjusted p-value ≤ 0.05).
We also remove the Difference in Percentage (pct1 - pct2) filter. This allows us to identify rare marker genes (for example, those expressed in only 10% of Cluster 11 cells, but absent elsewhere) that can still be critical for defining the unique identity of this cluster.
Based on these reasons, we will apply the following filtering criteria for the Cluster 11 vs others analysis:
Adjusted p-value: Min:
[empty]- Max:0.05Log2 FC: Min:
2- Max:[empty]Average expression in Group 1: Min:
1- Max:[empty]
Follow these steps depicted in the image below:
A: Open the filtering panel.
B: Apply the filtering criteria.
Visualize Marker Genes Expression Patterns for Clusters 4, 11, 12, and 14
Here, we will visualize the expression pattern of these markers genes in Cluster 4, Cluster 11, Cluster 12, and Cluster 14 to confirm that the selected genes are consistently and uniquely expressed in the target populations.
Follow these steps to visualize the expression patterns:
Click the
Featuresbutton to switch to the Features tab in the Left Sidebar.Ensure the settings in the Top Toolbar are configured as follows:
Visualization embedding:
pca- Specifies the embedding used for visualization.Normalization method:
LogNorm- Specifies the normalization applied to the data.Plot Type:
Scatter- Specifies the type of chart displayed.Plot blending mode:
Separate- Specifies the blending mode used for visualization.
Under Gene set collections in the left sidebar, locate the created collection named
Cluster Markers.Click the
 button next to the following labels:
Marker genes for Cluster 4 vs othersMarker genes for Cluster 11 vs othersMarker genes for Cluster 12 vs othersMarker genes for Cluster 14 vs others
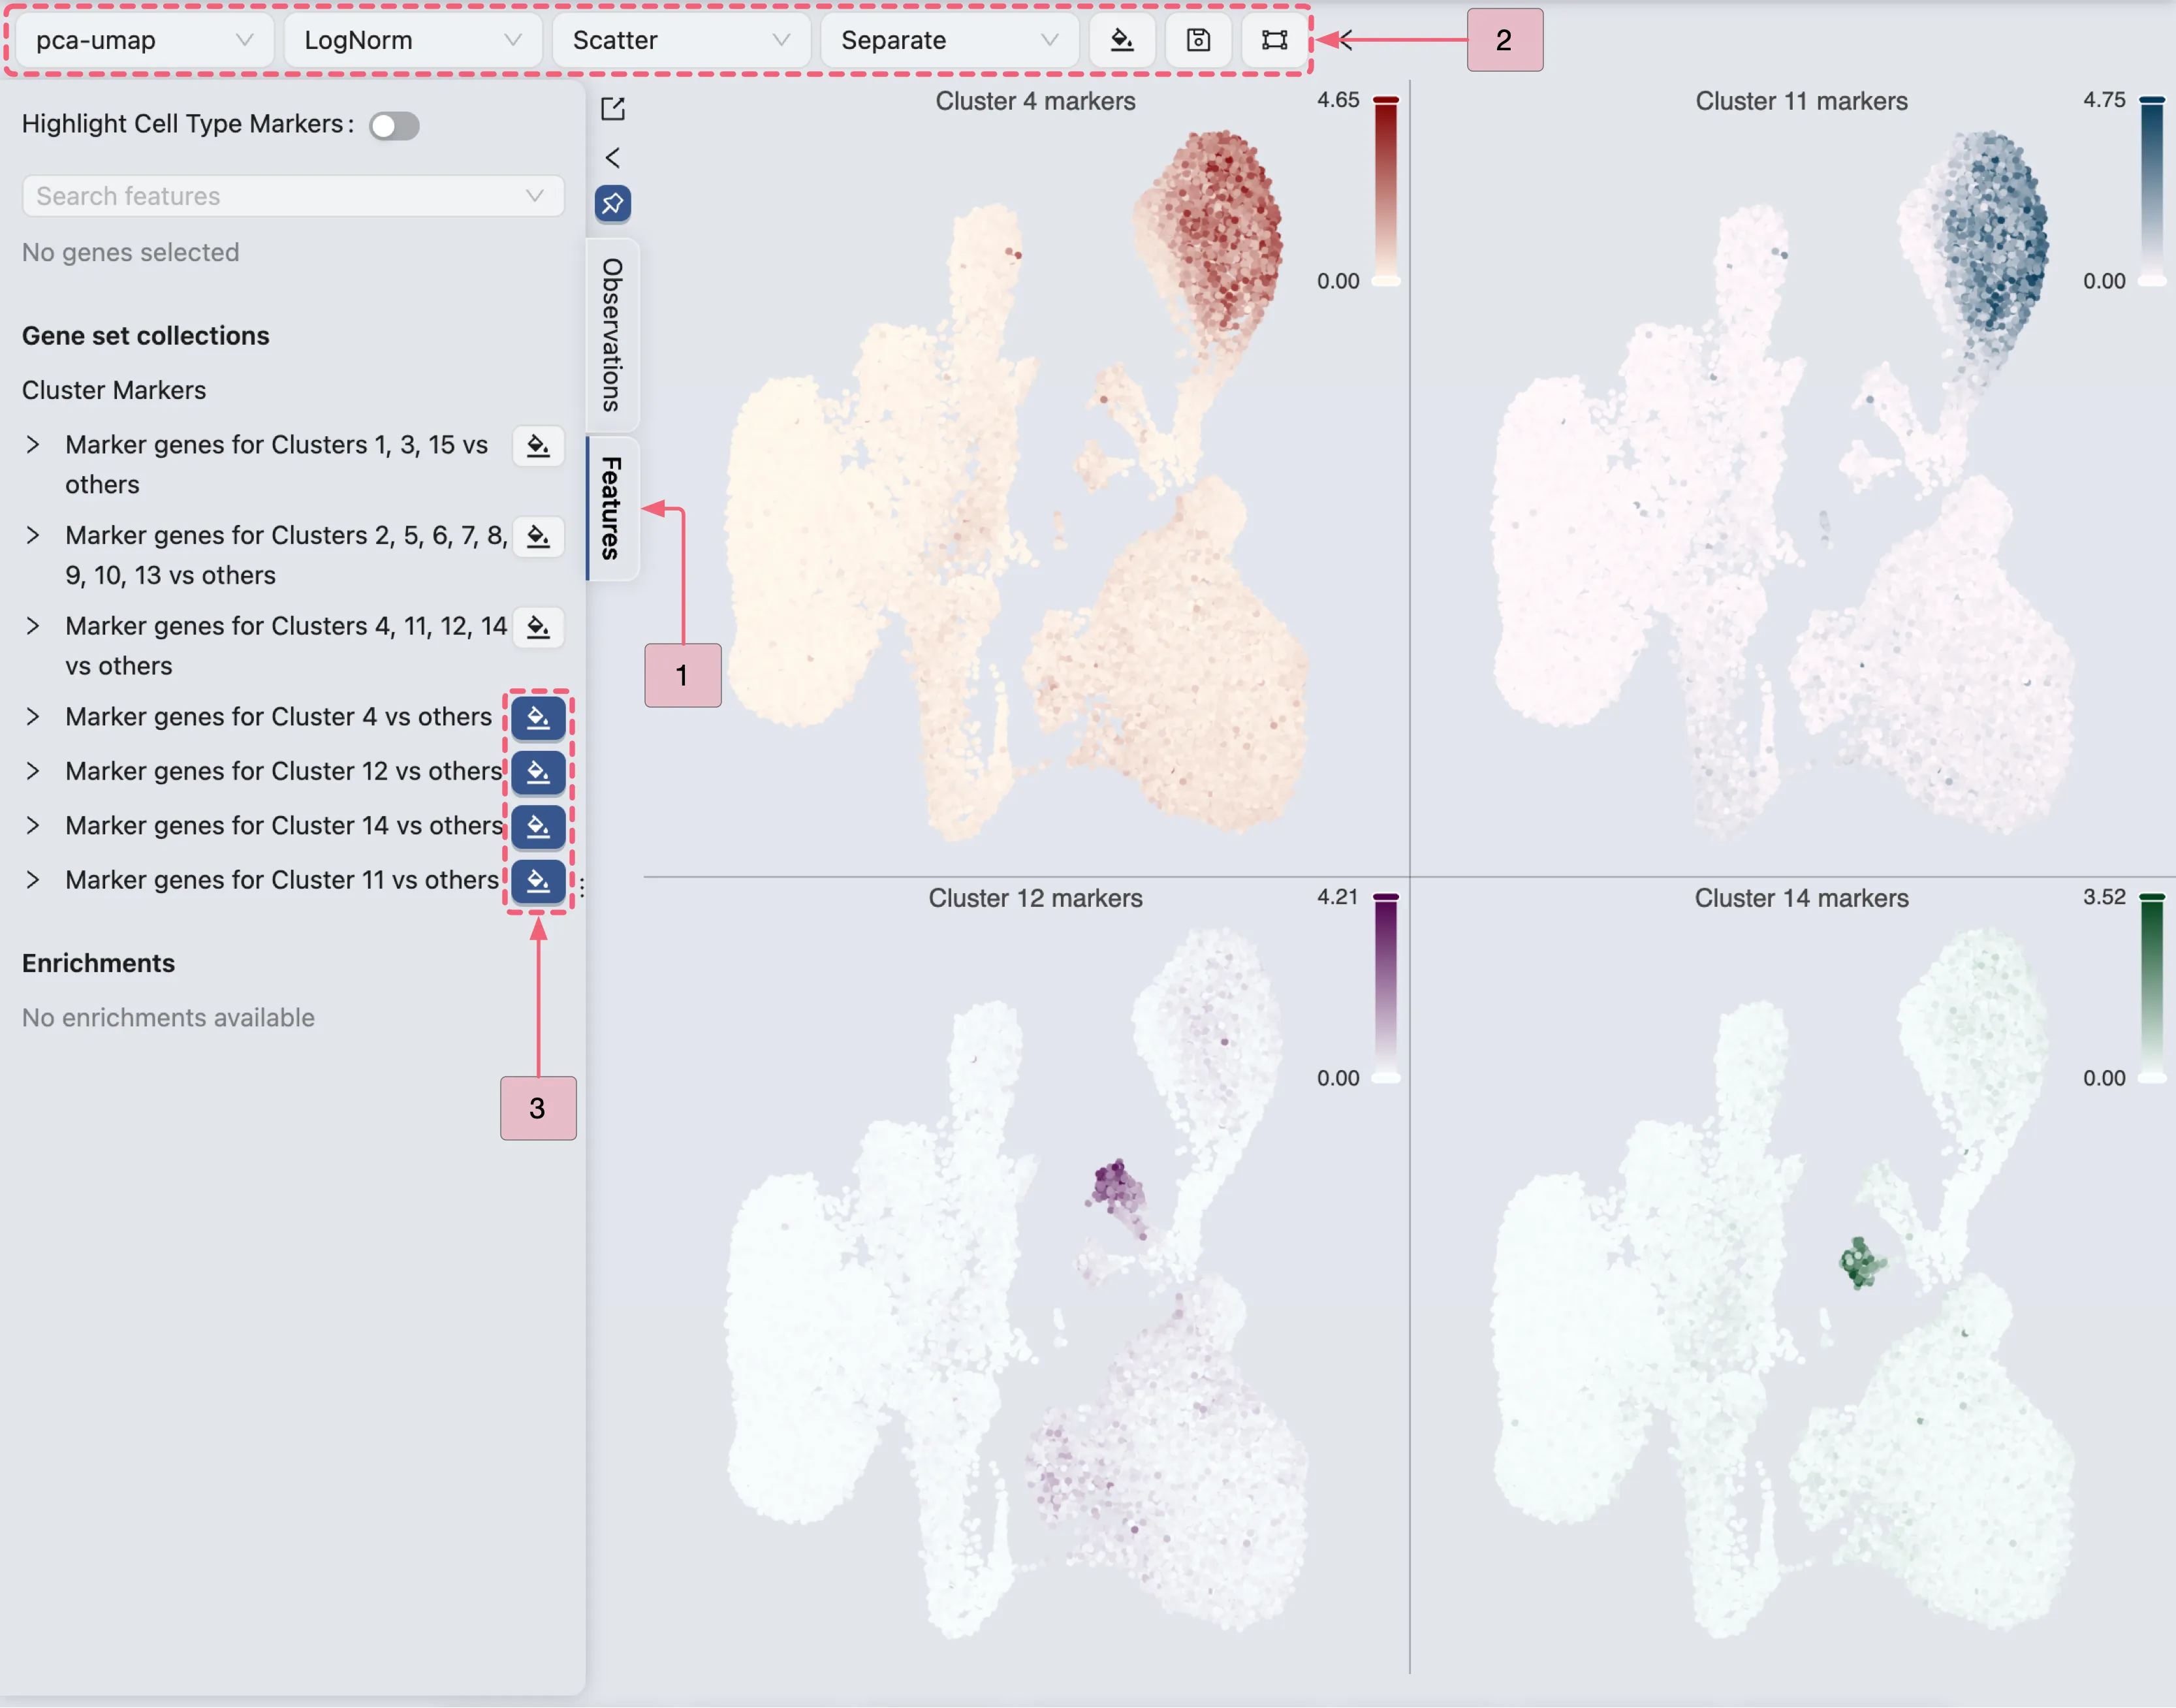
To replicate this visualization above, configure the settings as follows:
Number of rows:
2. Determines the number of rows in the grid layout.Sync zoom:
Enable. Enabling this option will synchronize the zoom level across all scatter plots in the grid.Show plot title:
Enable. This option displays the title of each plot in the grid. You can position the title to theleft,center, orright.In the visualization settings table: Update the plot titles as shown in the image below.

By observing the expression patterns of the markers in each cluster, we can confirm that:
Cluster 12: The marker genes in this cluster are highly expressed within this cluster and show negligible expression in other populations. Therefore, we are confident that Cluster 12 represents a unique cell type.
Cluster 14: Similarly, its marker genes are predominantly expressed within this cluster and show minimal expression elsewhere. Thus, we are confident that Cluster 14 also represents a unique cell type.
Cluster 4 and 11: The expression pattern of marker genes in these two clusters are very similar, indicating that they likely represent the same cell type. Therefore, we will merge clusters
4and11by performing differential expression analysis for Clusters 4 and 11 versus others.
Grouping Clusters 4 and 11
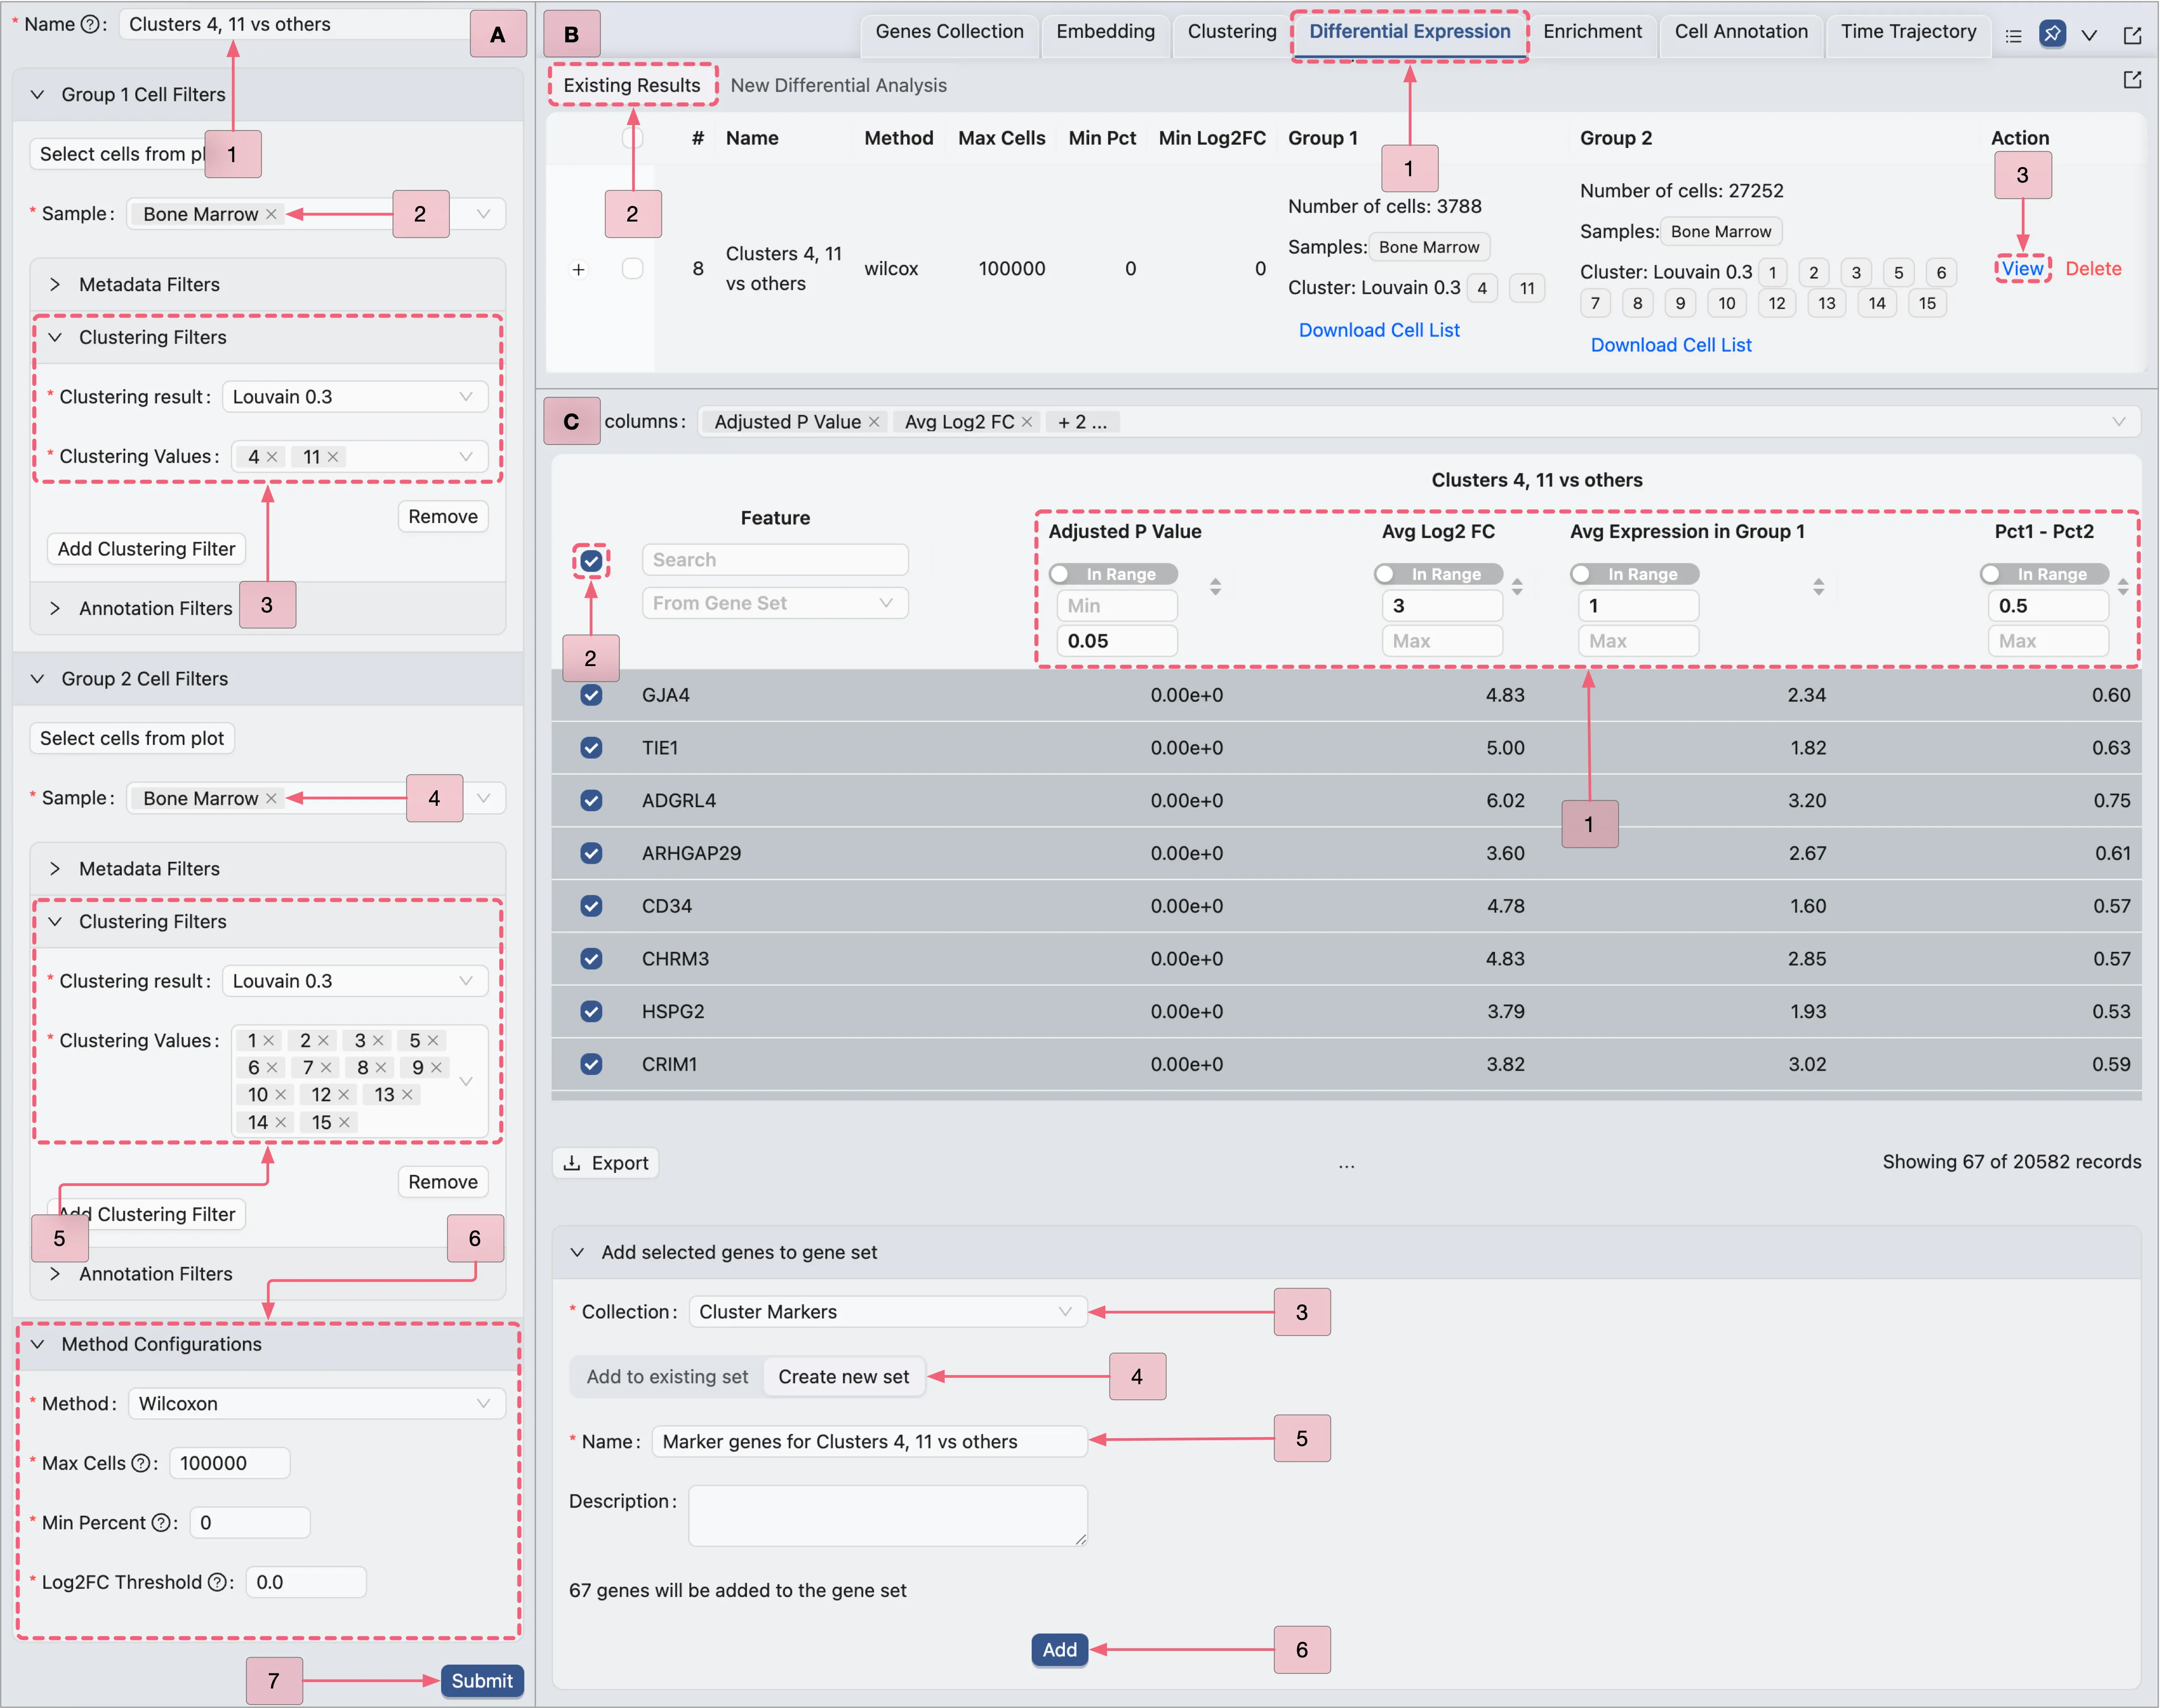
To merge Clusters 4 and 11 into a single cell type, we will perform a differential expression analysis comparing Clusters 4 and 11 against all other clusters.
Click the
Differential Expressiontab in the Bottom Drawer to navigate to the Differential Expression Table.Click the
New Differential Expressionbutton to open the analysis creation form. Select theCustomoption and follow the procedure outlined in the image below:A. Configure analysis settings: Set parameters for the DE comparison.
B. View results: Open the DE result page after running the analysis.
C. Save marker genes:: Filter the result table and add significantly expressed genes to the
Cluster Markerscollection.
Cell Type Annotation
Cell Type Inference
Through visualization, clustering, and differential expression (DE) analysis, we have identified five distinct cell populations in the dataset.
Population I: Clusters
1,3,15Population II: Clusters
2,5,6,7,8,9,10,13Population III: Clusters
4,11Population IV: Cluster
12Population V: Cluster
14
Infer Cell Types in the Populations I, II, III, V
To infer cell types in the identified populations, we will use CytoAnalyst built-in cell type inference tool to search for potential cell types in each population, based on the marker genes identified in the previous steps:
Click the
Genes Collectiontab in the Bottom Drawer.Click the
Existing Collectionsbutton.Click the
 icon next to the
 Cluster Markerscollection to view its contents.
The Collections Table consists of three main components:
Collection: Allows you to update the collection's information.
Gene Sets: Enables you to add a new gene set to the collection.
Gene Set Table: Enables you to view and manage gene sets within the collection.
In the Gene set table, follow these step to use the inference tool:
In the
Actionscolumn for each gene set, click theInfer Cell Typesbutton to initiate cell type inference.
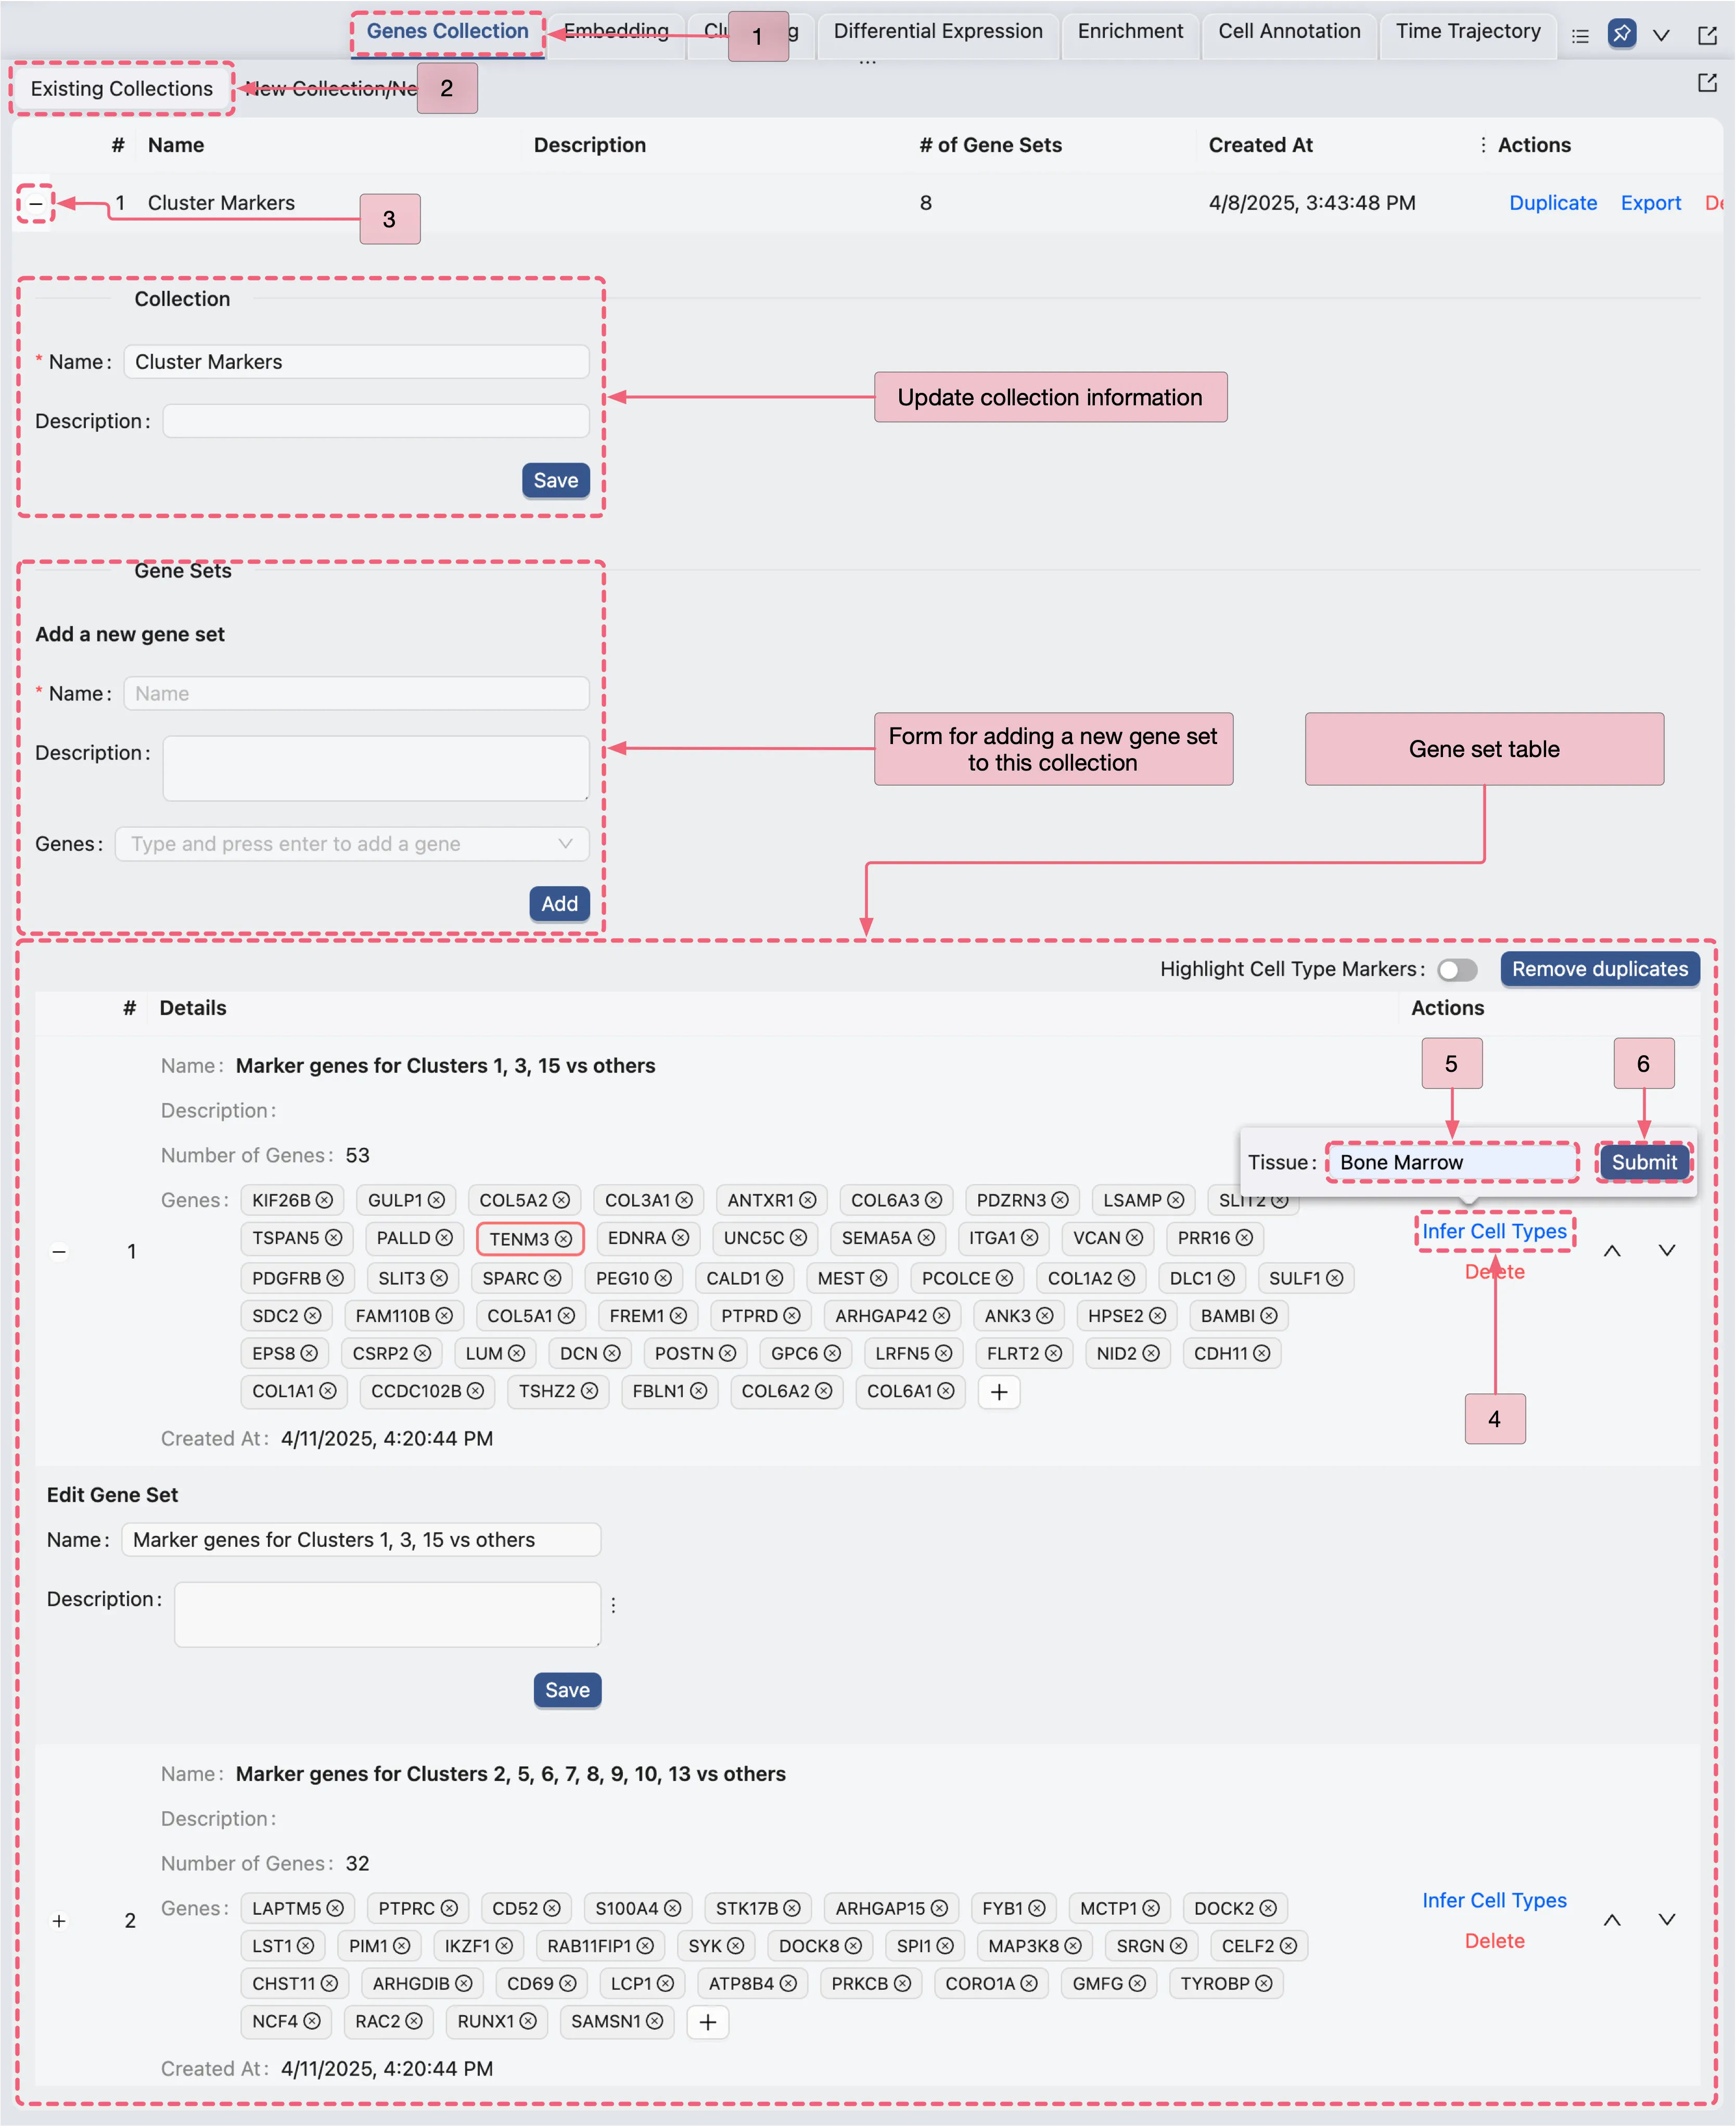
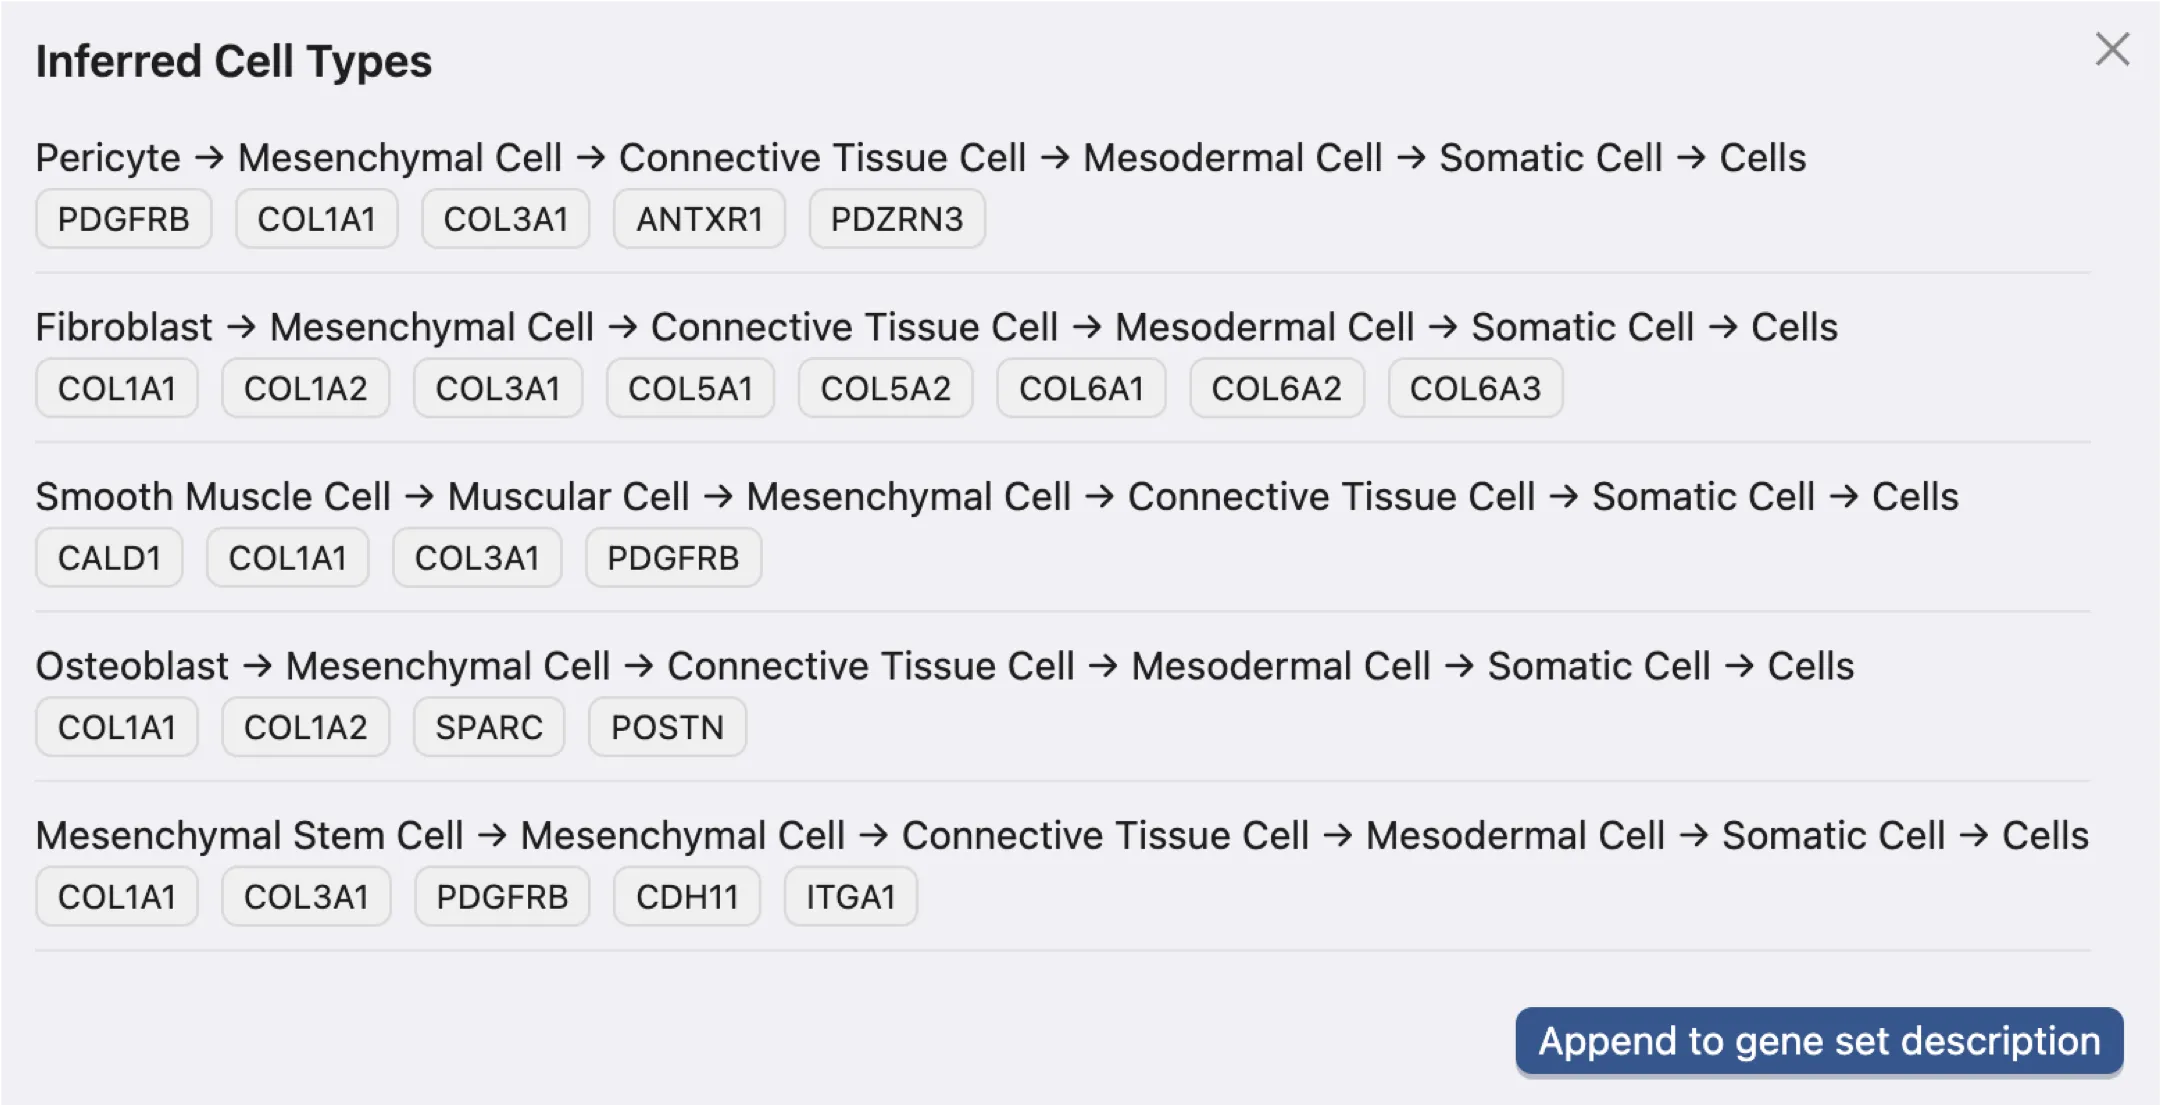
Once the inference process completes, a popup titled Inferred Cell Types will appear, where you can preview the inferred cell types. The cell type assignment strategy works as follows:
Select the label that appears most frequently in the top predicted cell types.
If multiple labels have the same frequency, prioritize the cell type with the earliest position (more fine-grained) in the cell ontology hierarchy.
Finally, click the
Append to gene set descriptionbutton to save the inferred cell type information to the gene set's description.
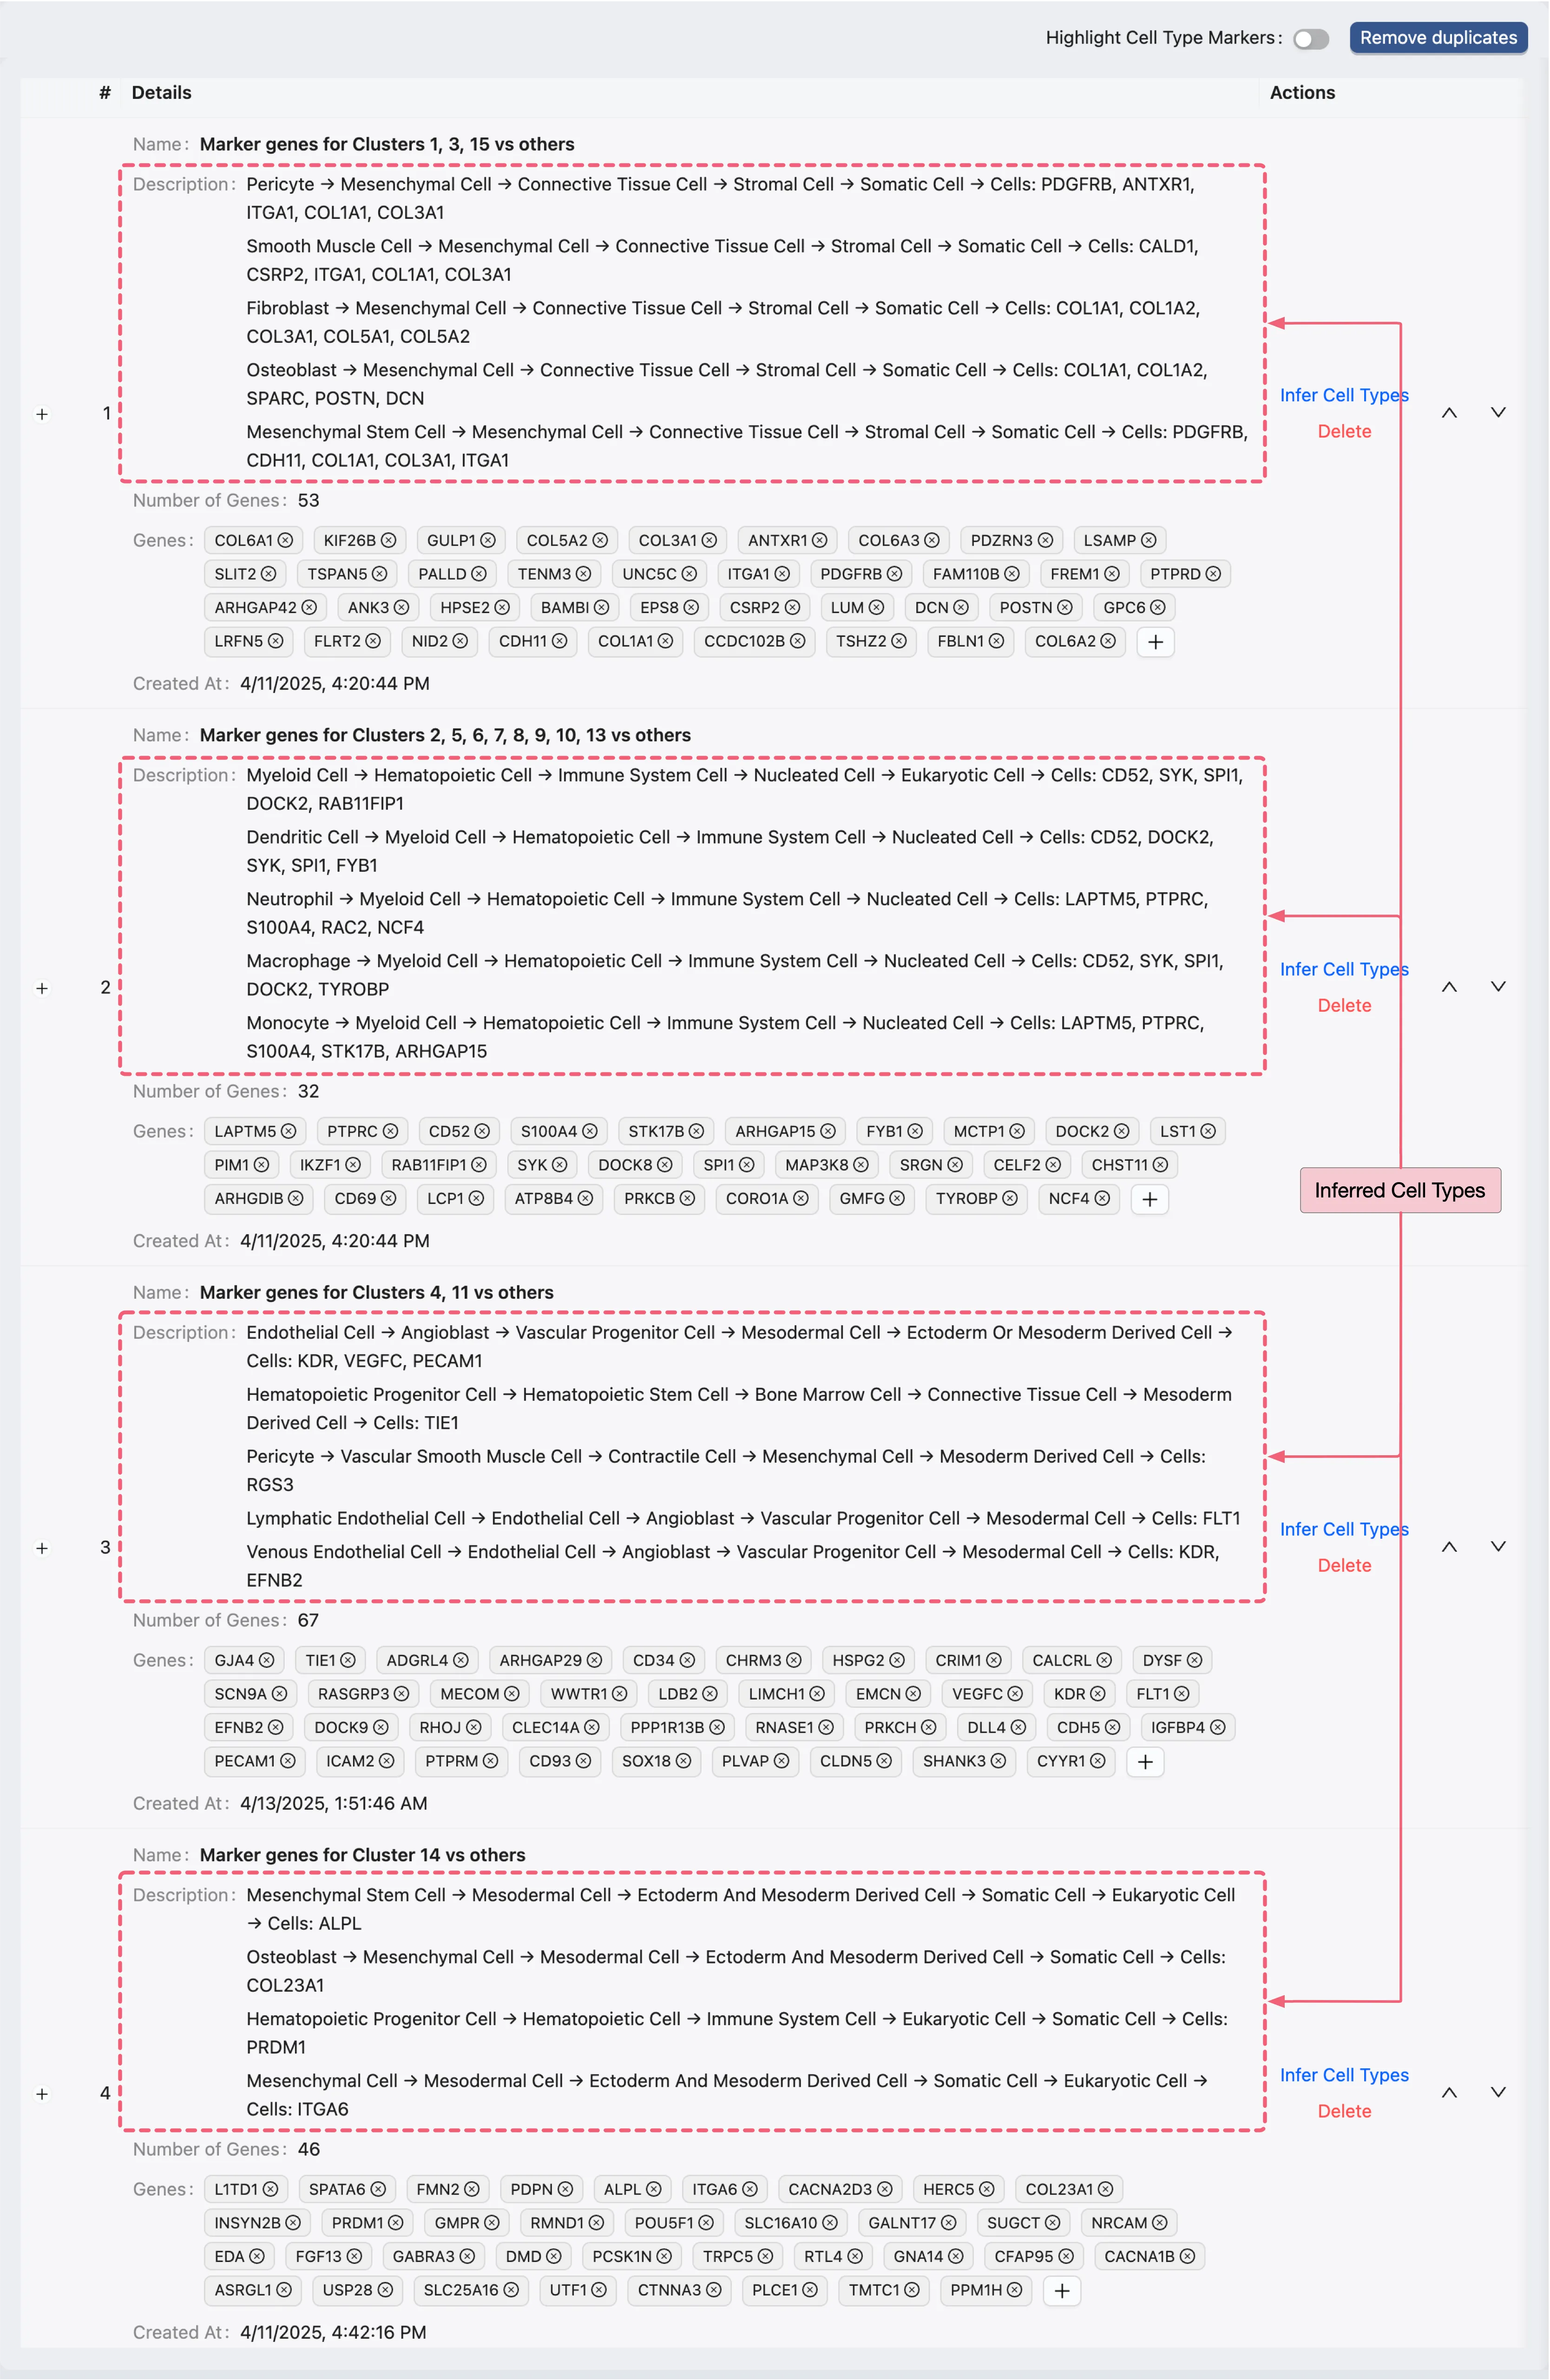
After appending the inferred cell types to the gene set collection, you can find the inference details in the description of each marker gene set within the Gene Set Table.
Inferred Cell Types for Population IV
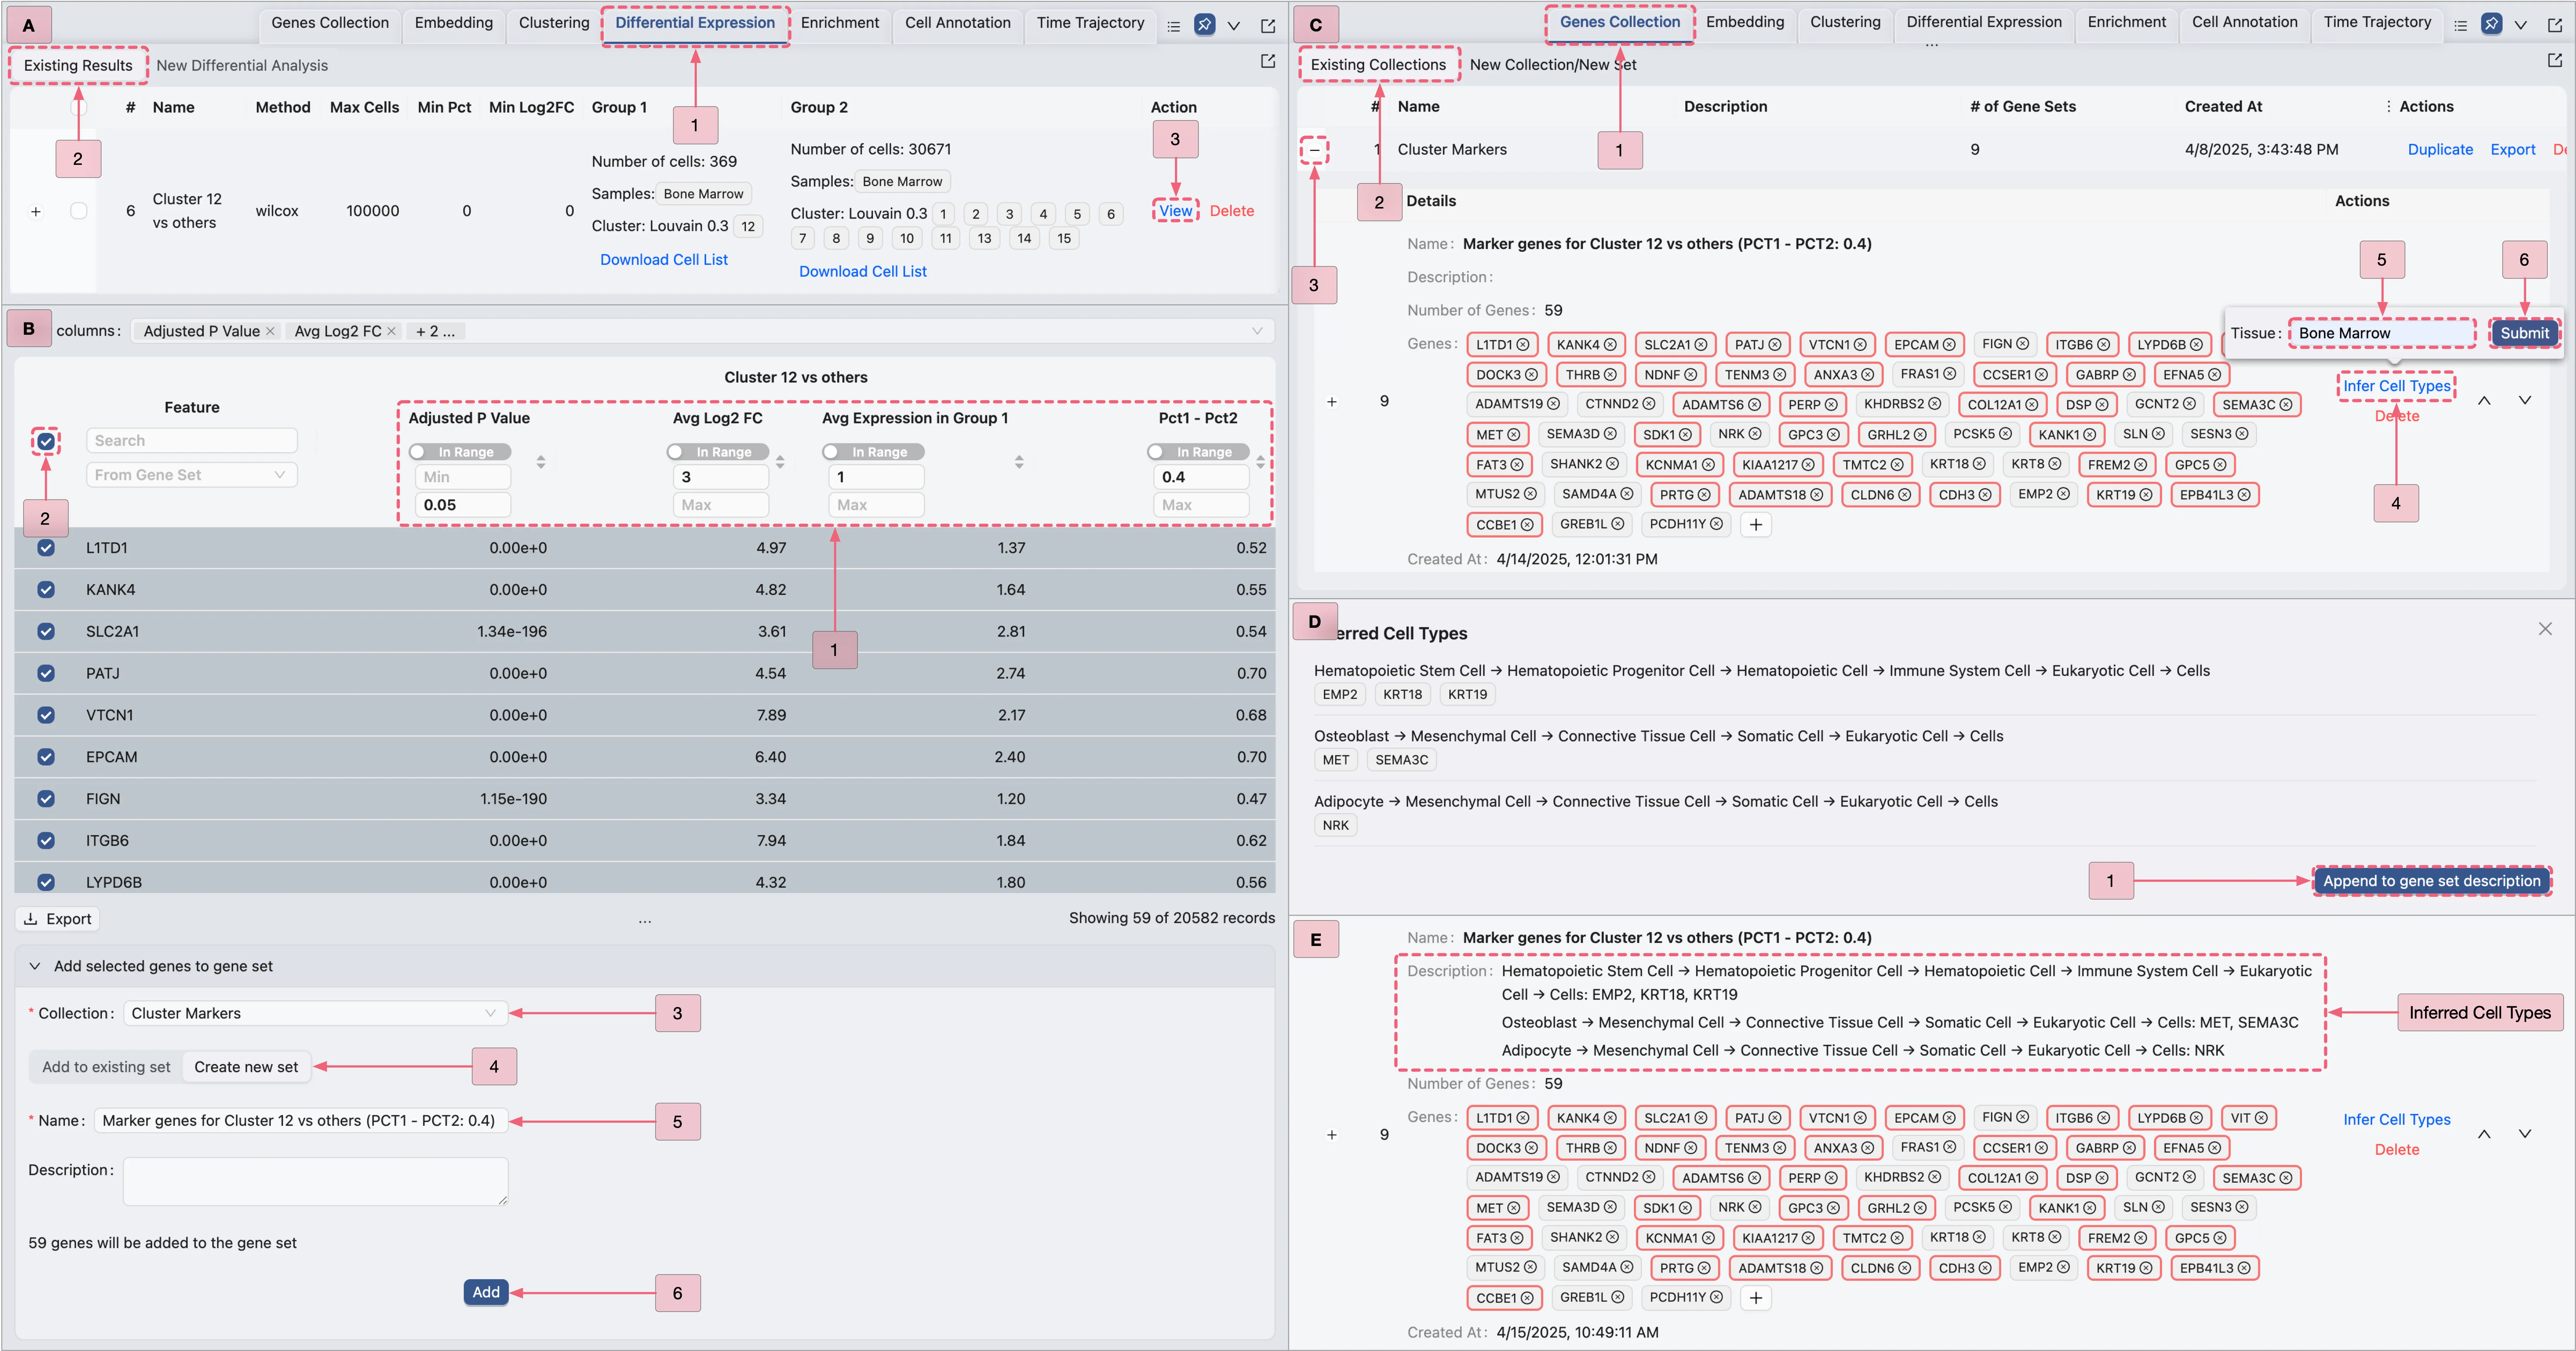
For Population IV (Cluster 12), inferring cell types using the built-in tools is challenging due to its marker genes not being well characterized. Therefore, we will refine the markers by filtering the marker genes of Cluster 12 using additional criteria to capture widely expressed genes.
Follow these steps as depicted in the image below:
A: Navigate to the
Cluster 12 vs othersanalysis result page.B: Filter the Result Table using the following criteria, then add the filtered genes to the
Cluster Markerscollection:Adjusted P Value: Min:
[empty]| Max:0.05Avg Log2 FC: Min:
3| Max:[empty]Avg Expression in Group 1: Min:
1| Max:[empty]Pct1 - Pct2: Min:
0.4| Max:[empty]
C: Perform cell type inference for the filtered genes.
D: Update the gene set description with the inferred cell types.
E: View the inferred cell types in the Gene Set Table.
Summarize Cell Types Inference
Based on the cell type assignment strategy, we will assign the inferred cell types to the corresponding clusters as follows:
Population I: Clusters
1,3,15→ Mesenchymal cells (assigned becauseMesenchymal cellsis the most frequent prediction).Population II: Clusters
2,5,6,7,8,9,10,13→ Hematopoietic cells (top three predictions consistently align with this type).Population III: Clusters
4,11→ Endothelial cells (appears in 4/5 predictions).Population IV: Cluster
12→ Mesenchymal cells (appears in 2/3 predictions).Population V: Cluster
14→ Mesodermal cells (appears in 3/4 predictions).
At this point, we observe that Populations I and IV share the same inferred cell type (Mesenchymal cells). Therefore, to simplify annotation, we will merge Clusters 1, 3, 15, and 12 into a single cell type labeled Mesenchymal cells.
The final cell type assignments are as follows:
Clusters
1,3,15,12→ Mesenchymal cells.Clusters
2,5,6,7,8,9,10,13→ Hematopoietic cells.Clusters
4,11→ Endothelial cells.Cluster
14→ Mesodermal cells.
Assign Inferred Cell Types to Each Cell Population
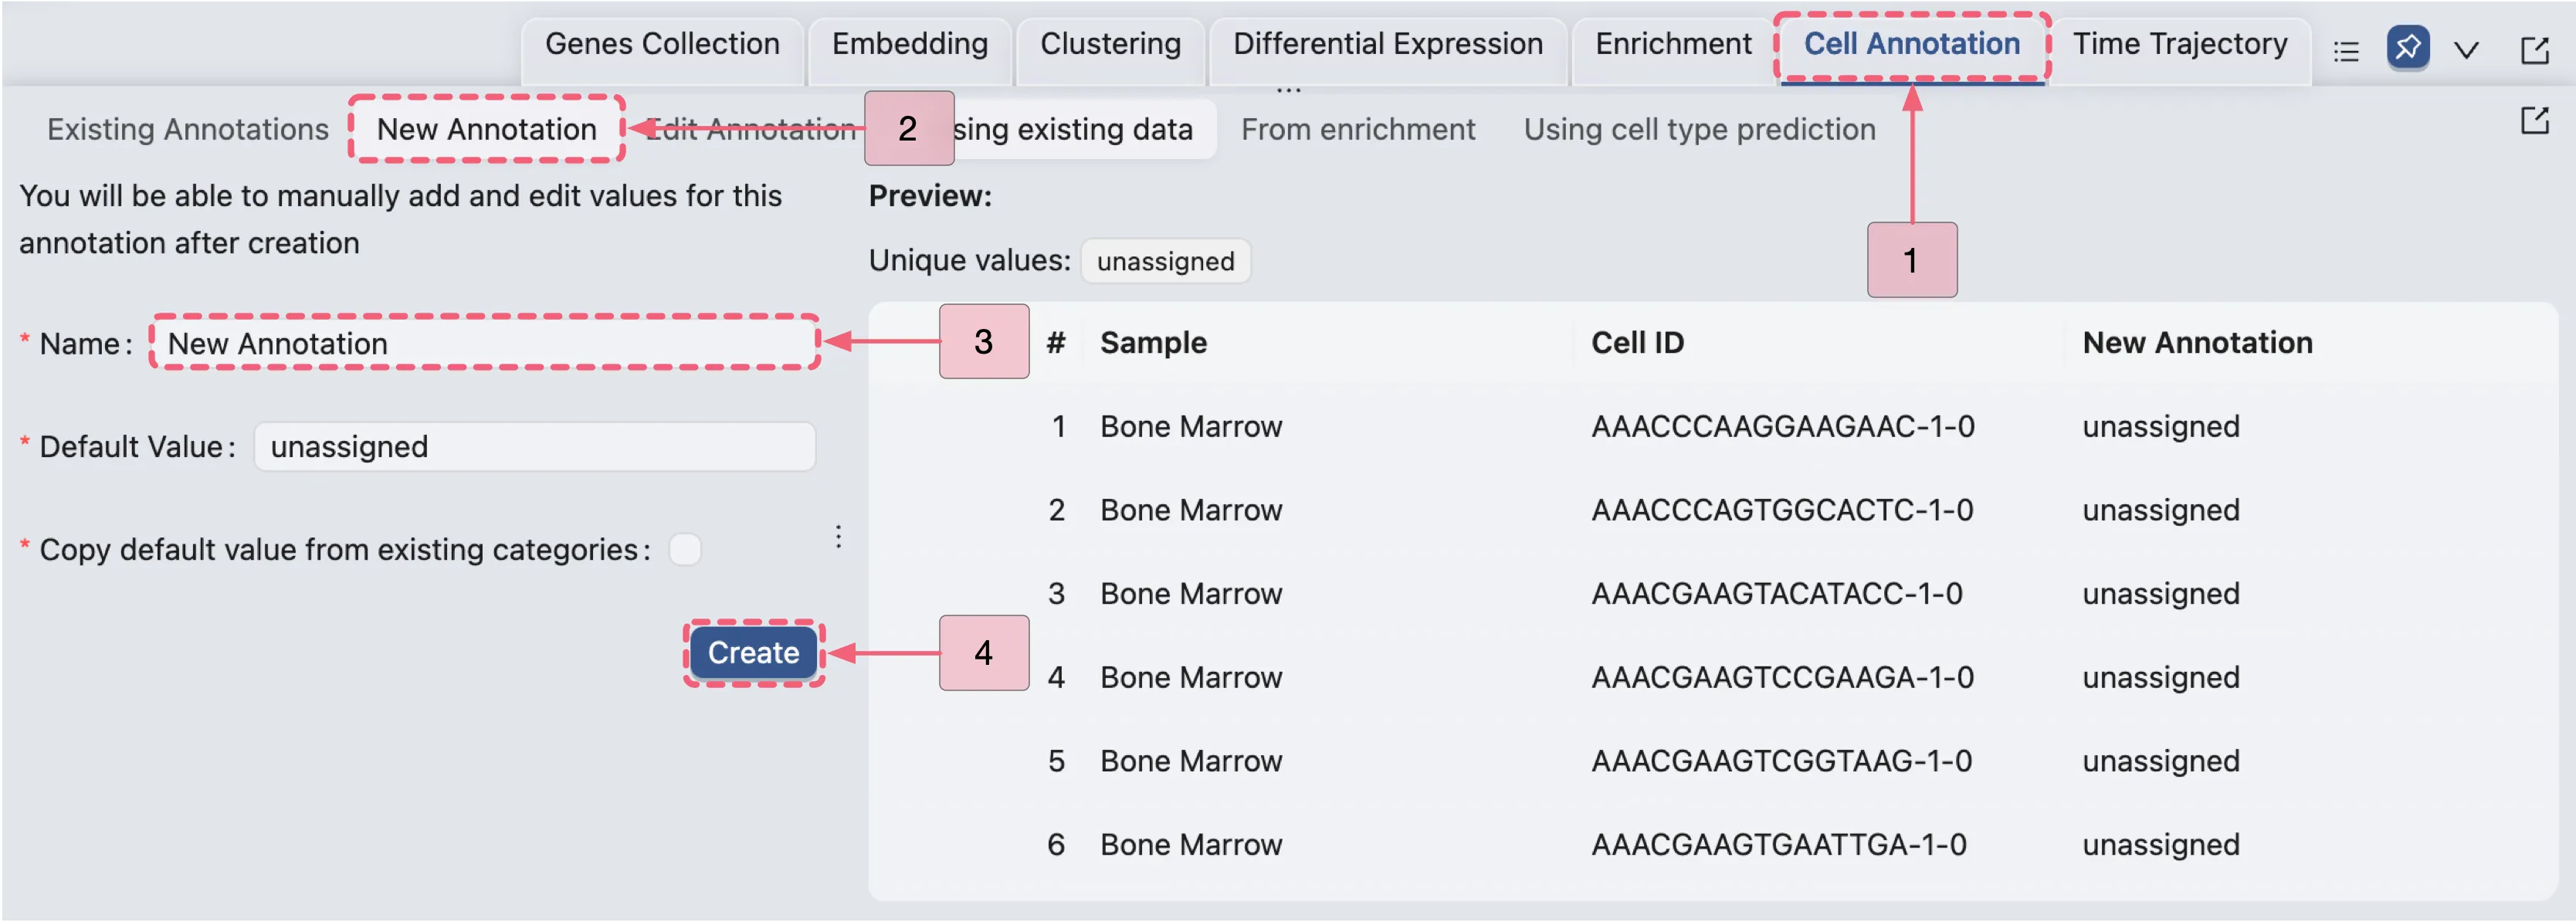
In this section, we will assign the inferred cell types to each cell population. Follow these steps to create an annotation and assign the inferred cell types to the corresponding clusters:
Click the
Cell Annotationtab in the Bottom Drawer.Click the
New Annotationbutton to open the Cell Annotation New Form.In the form, configure the following settings:
Name:
New Annotation. Specifies the annotation identifier.Default value:
unassigned. Assigns this label to all cells initially or where data is missing.Copy default value from existing categories:
disabled. Enable this option if you want to copy the default value from other metadata, clusters, or annotations. For this case study, we will not use this option.
Finally, click the
Createbutton to create the new annotation.
Assign Inferred Cell Type to Clusters 1, 3, 15, and 12
Once the new annotation has been created, we will assign Mesenchymal cell to the corresponding clusters.
Click the
Edit Annotationbutton in the Bottom Drawer.Enable
Show clusteringoption to display cluster selection options.Select the
Louvain 0.3clustering to populate the table with cluster labels.In the Cluster column, select clusters
1,3,15, and12to retain only cells belonging to these clusters.Click the checkbox next to the
Samplecolumn header to select all visible cells.From the
Select annotationdropdown, chooseNew Annotation.In the New value field, type
Mesenchymal cell.Finally, click the
Assignbutton to annotate the selected cells.
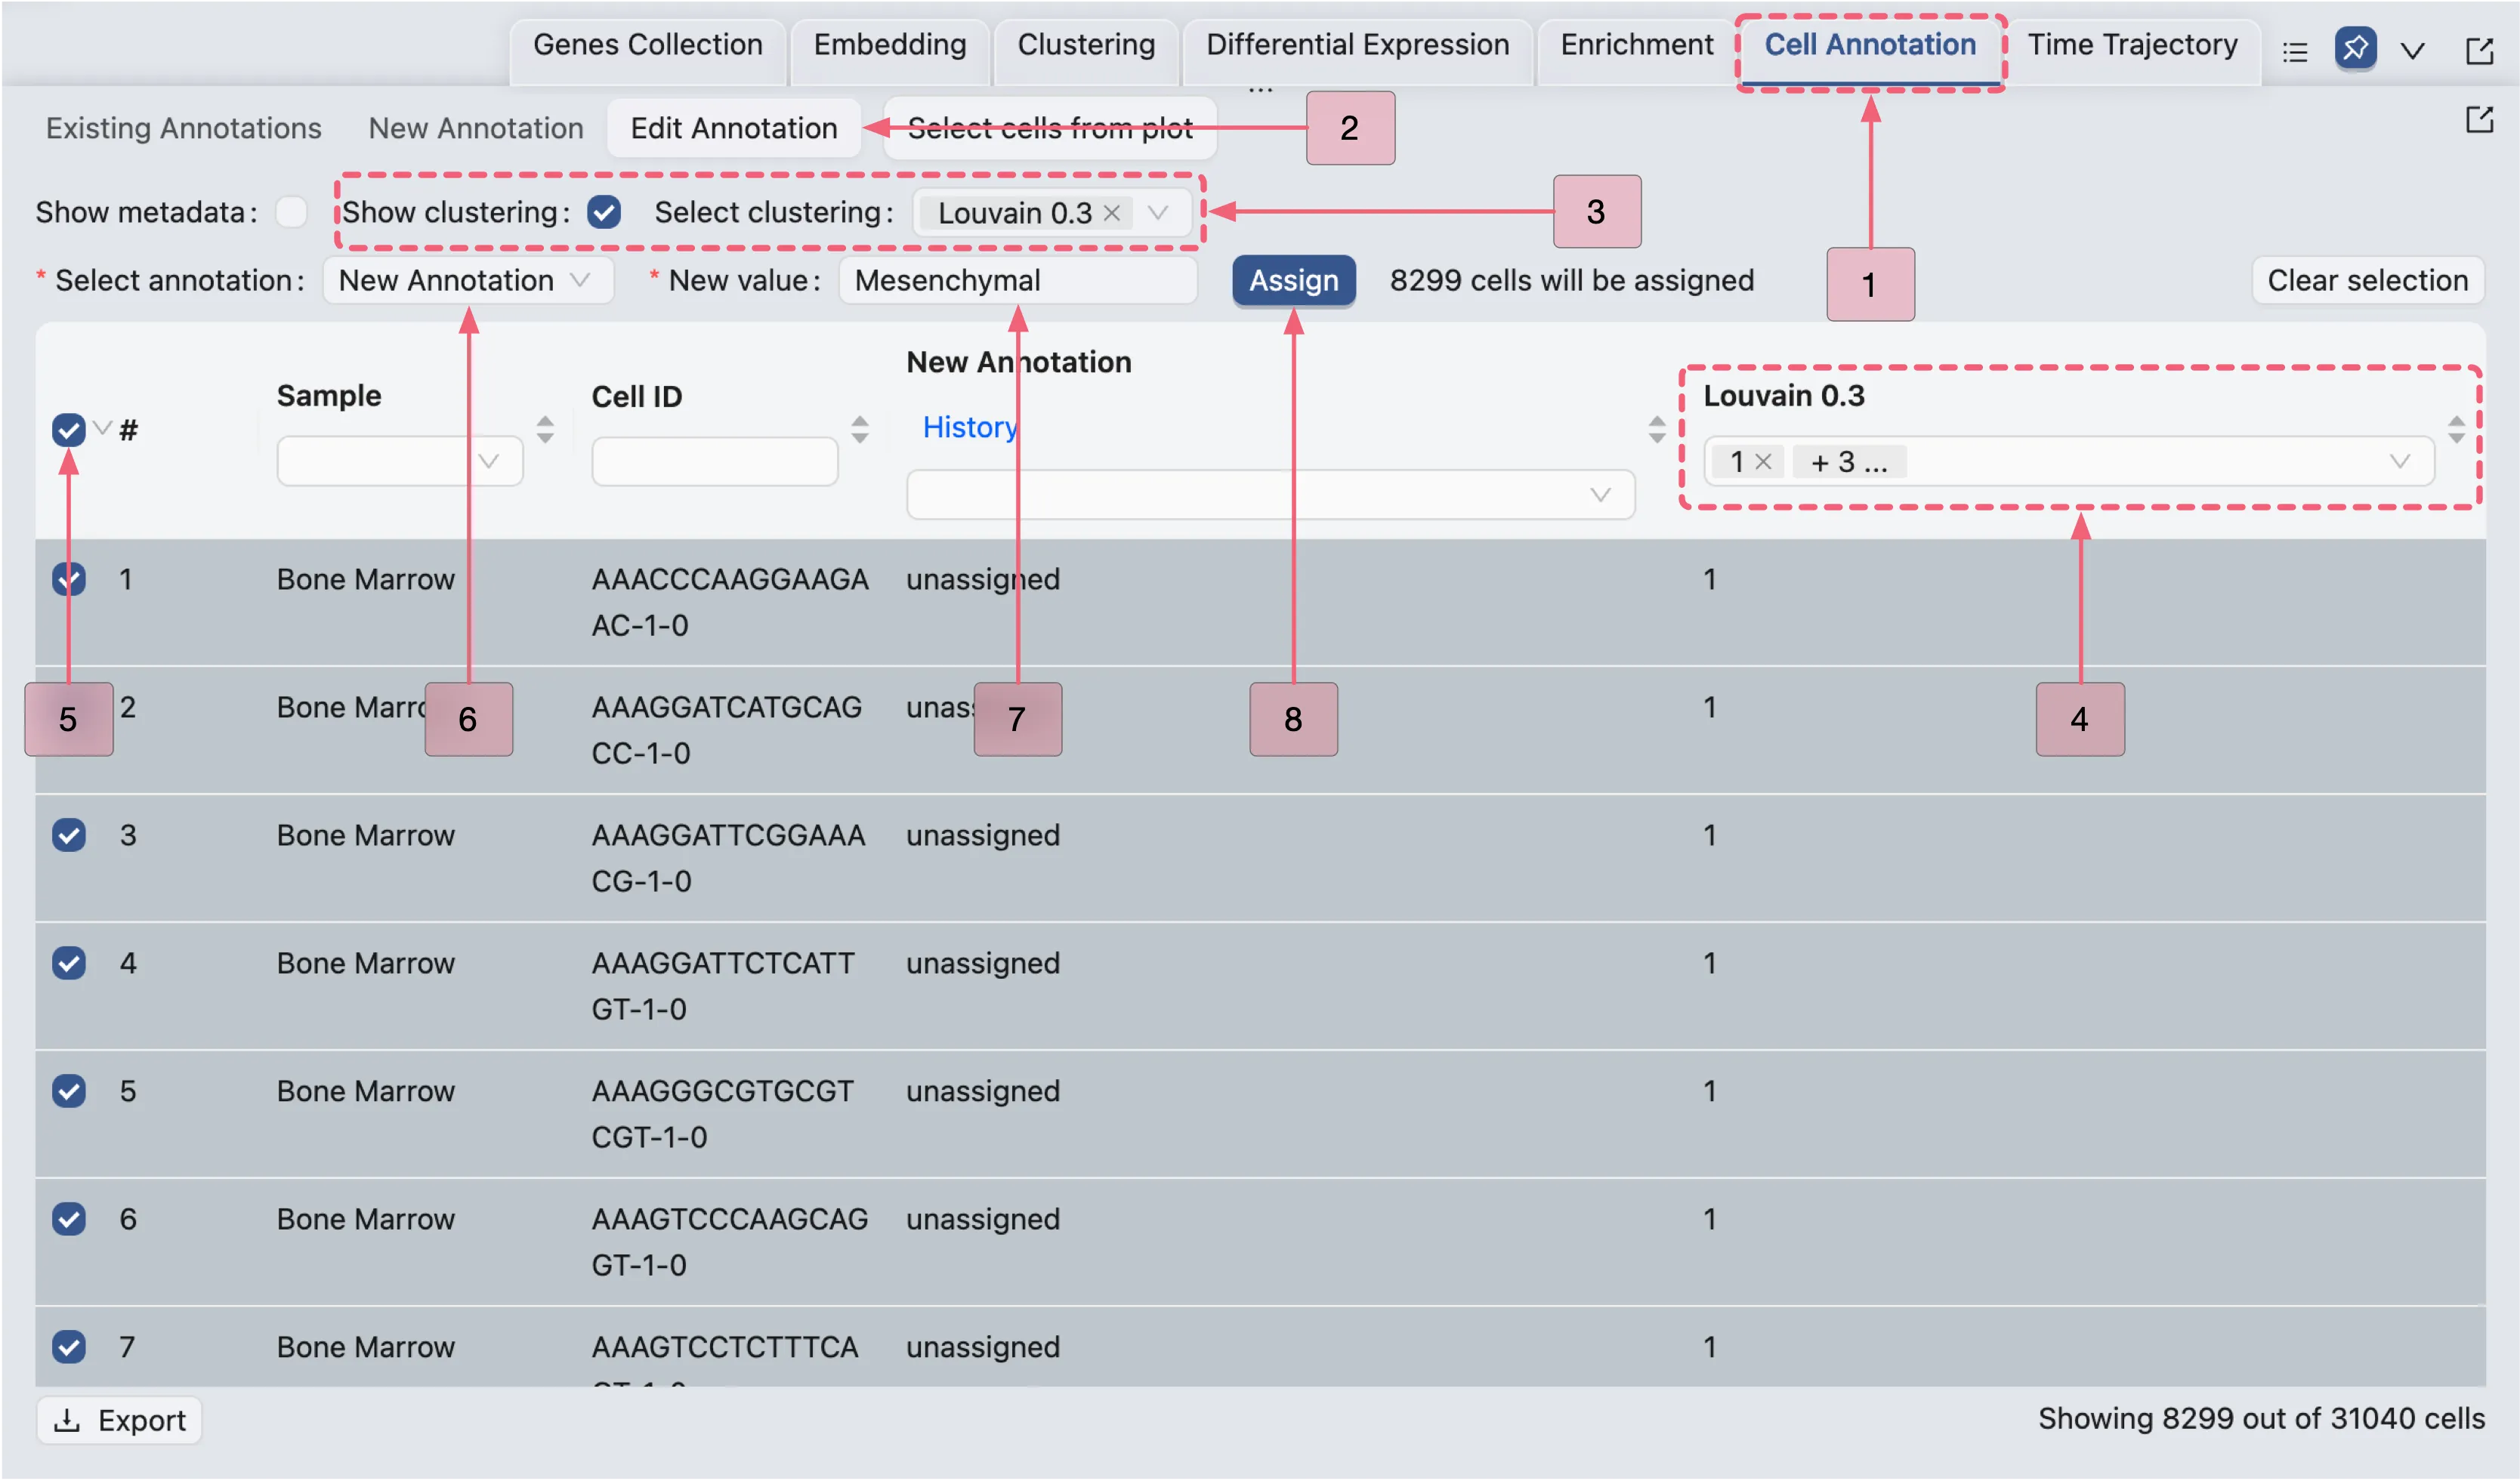
Assign Inferred Cell Types to the Remaining Clusters
Repeat these steps to annotate the remaining cell populations:
Clusters
2,5,6,7,8,9,10,13→ Hematopoietic cellClusters
4,11→ Endothelial cellCluster
14→ Mesodermal cell
Visualize Cell Type Annotation Results
In this section, we will visualize the final annotated cell types and compare them with the original cell types from the original study's annotation.
Follow these steps to achieve this:
Step 1: Navigate to the
Observationstab by clicking theObservationsbutton in the Left Sidebar.Step 2: Configure the Top Toolbar settings as follows:
Visualization embedding:
pca(Determines the embedding used for plotting).Normalization method:
LogNorm(Applies logarithmic normalization to the data).Plot Type:
Scatter(Specifies the type of chart displayed).Plot blending mode:
Separate(Specifies the blending mode used for visualization).
Step 3: Under Annotation category, click the
 button next to the created annotation named
 New Annotationto visualize the annotated cell types.Step 4: Under Categorical Metadata, click the
 button next to the
 cell_typeto visualize the original cell type from the original study.
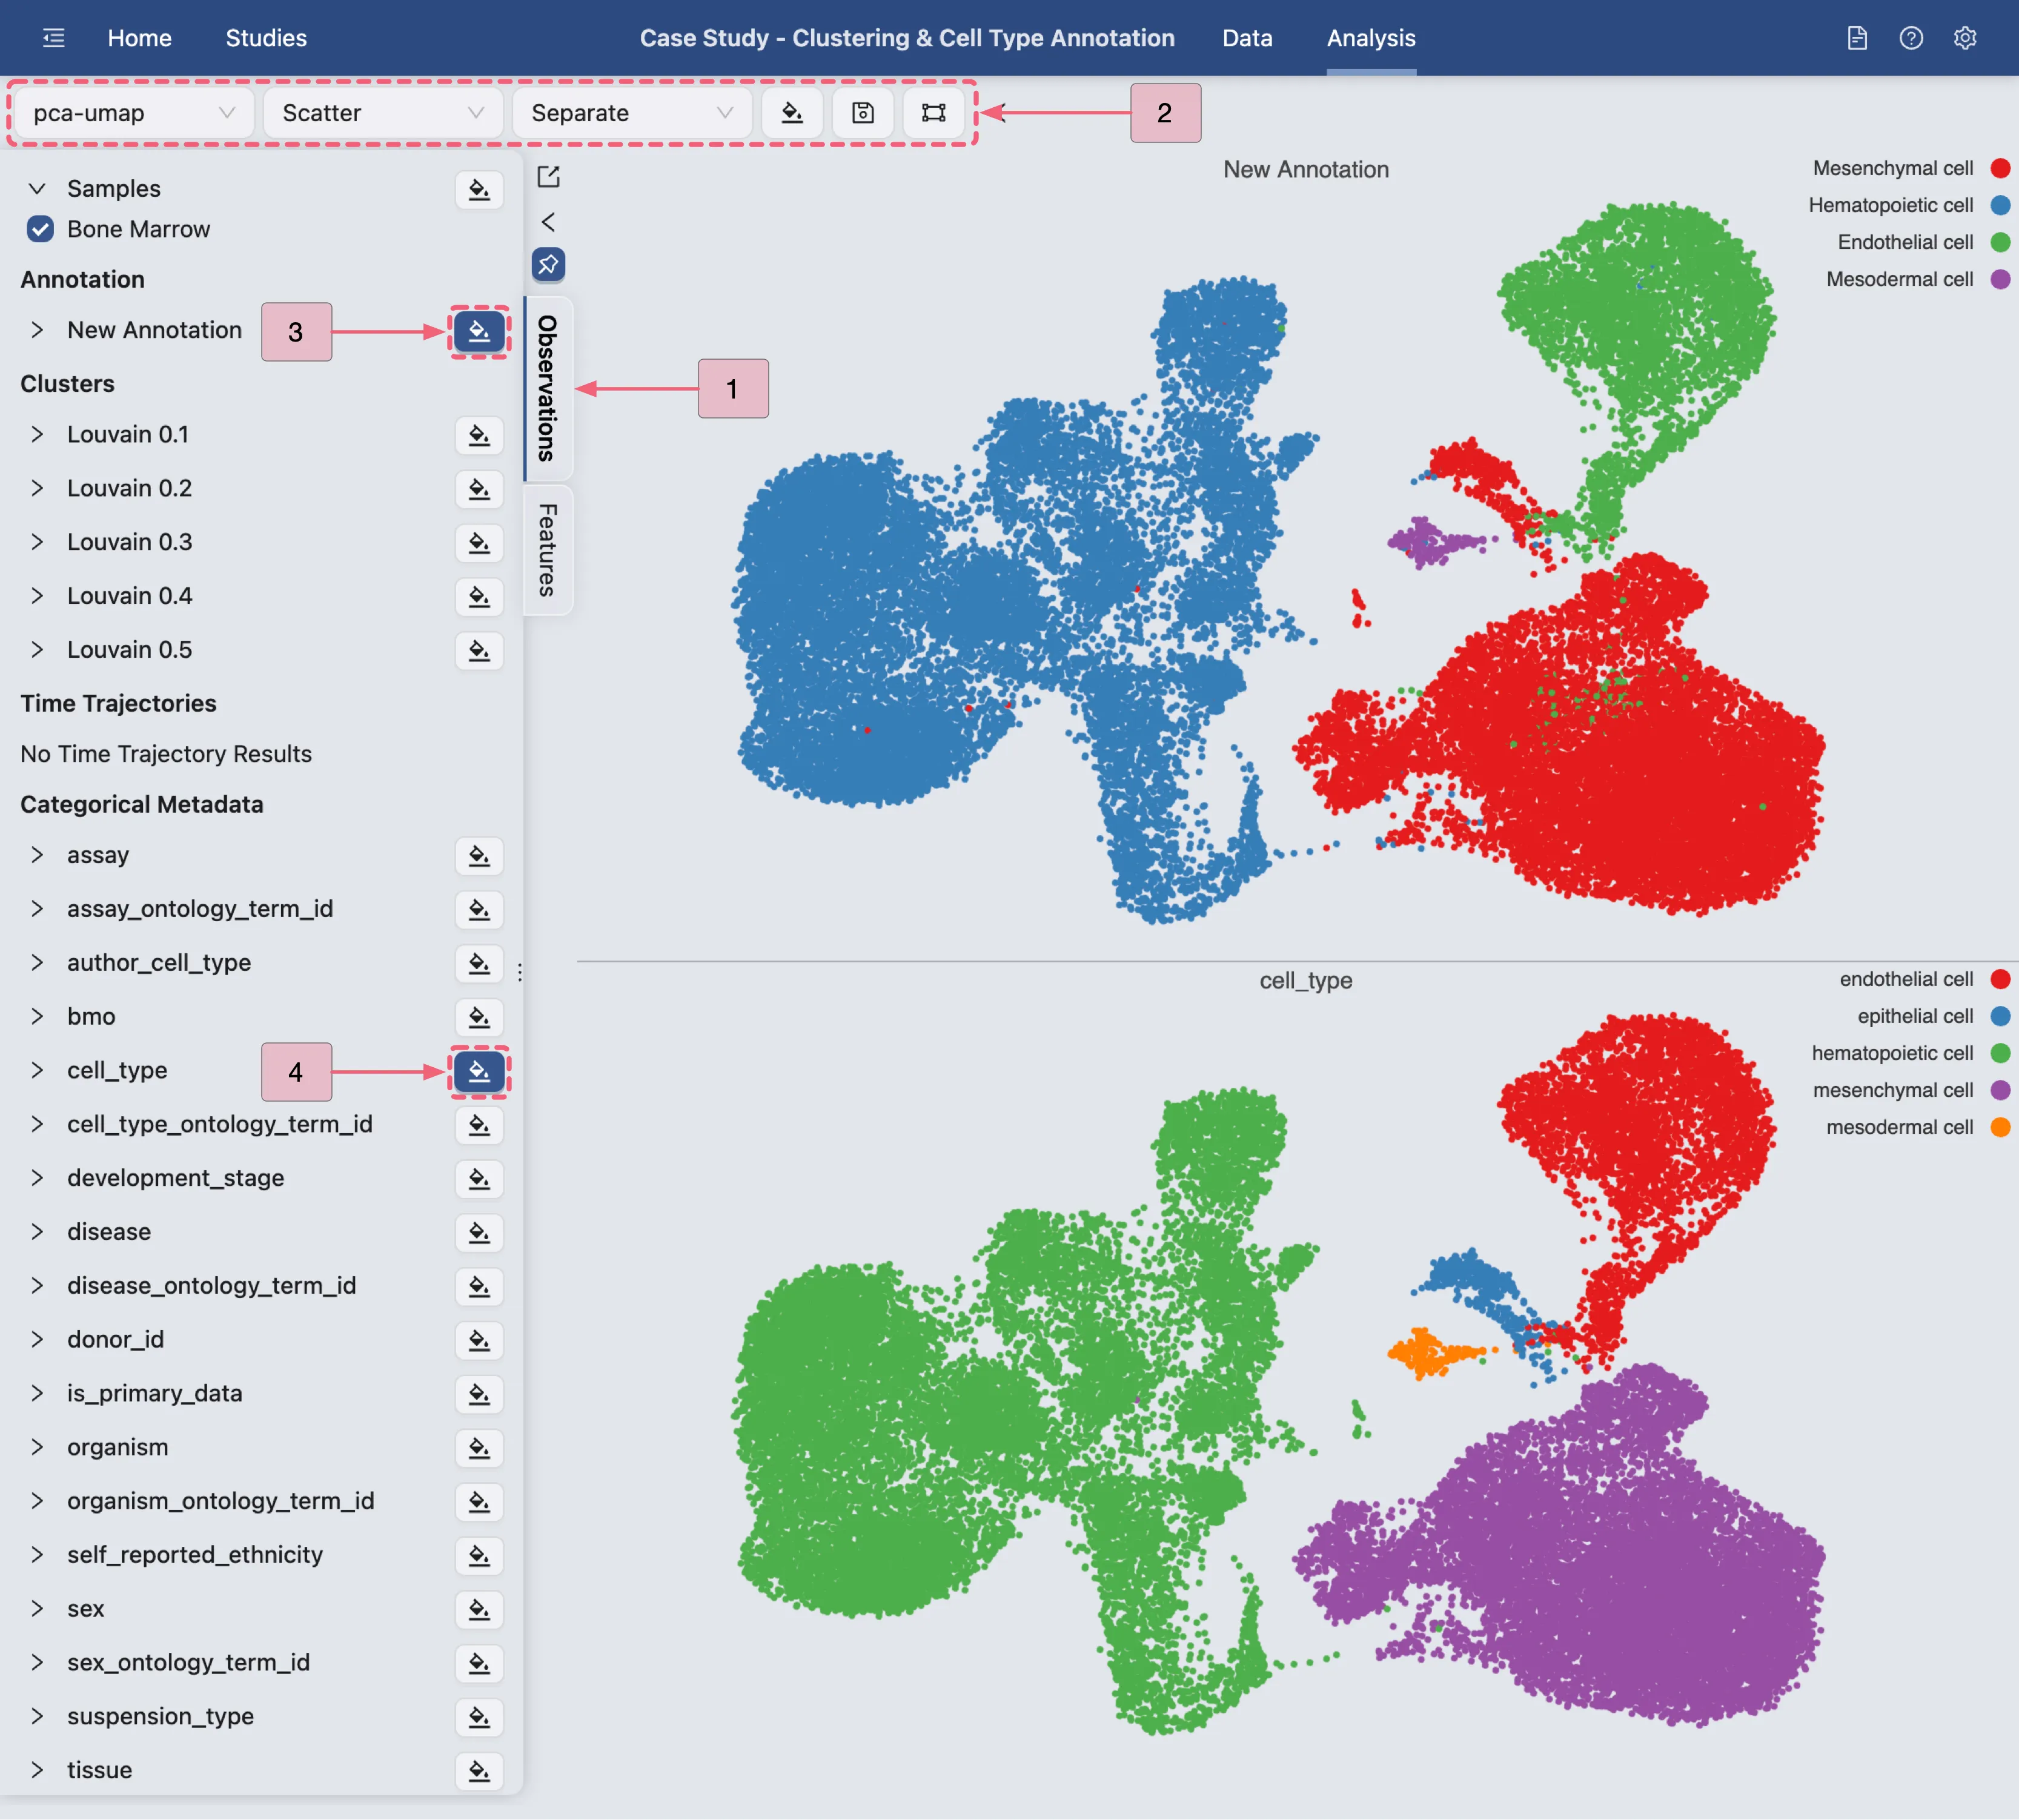
The image above illustrates the final cell type annotation result for both the inferred cell types and the original study's annotation.
We observe that CytoAnalyst ’s results are highly consistent with the original cell type assignments.
A key difference is that the original study classified Cluster 12 as Epithelial cells, whereas CytoAnalyst assigned it to Mesenchymal cells.
Our analysis revealed that, in fact, Endothelial cells can undergo Endothelial-to-Mesenchymal Transition (EndMT), a process where they lose Endothelial markers and acquire Mesenchymal traits.
Therefore, we hypothesize that Cluster 12 represents cells undergoing EndMT, explaining the discrepancy in annotations. Based on external evidence from flow cytometry data, we further hypothesize that the original study's authors may have distinguished between these two cell types using additional experimental validation.