Differential Expression Analysis
On this page, you will find information about how to perform differential expression analysis in CytoAnalyst.
What is Differential Expression Analysis?
Differential expression analysis is a technique used to identify genes that are differentially expressed between two or more groups of cells or samples. It helps to understand the biological differences between the groups and identify genes that are associated with specific cell types, conditions, or treatments.
In CytoAnalyst, differential expression analysis can be performed in several ways:
Between Clusters: Compare one cluster against all other clusters.
Within Clusters: Within a cluster, compare one group of cells against another group of cells. You can define the groups based on metadata, annotations, or other clustering results.
Similarly, you can compare Between Metadata Groups, Between Annotations, Within Metadata Groups, and Within Annotations.
You can also select any group of cells from visualizations, combine with filters on metadata annotations, or clusters, and perform differential expression analysis on them.
Navigation
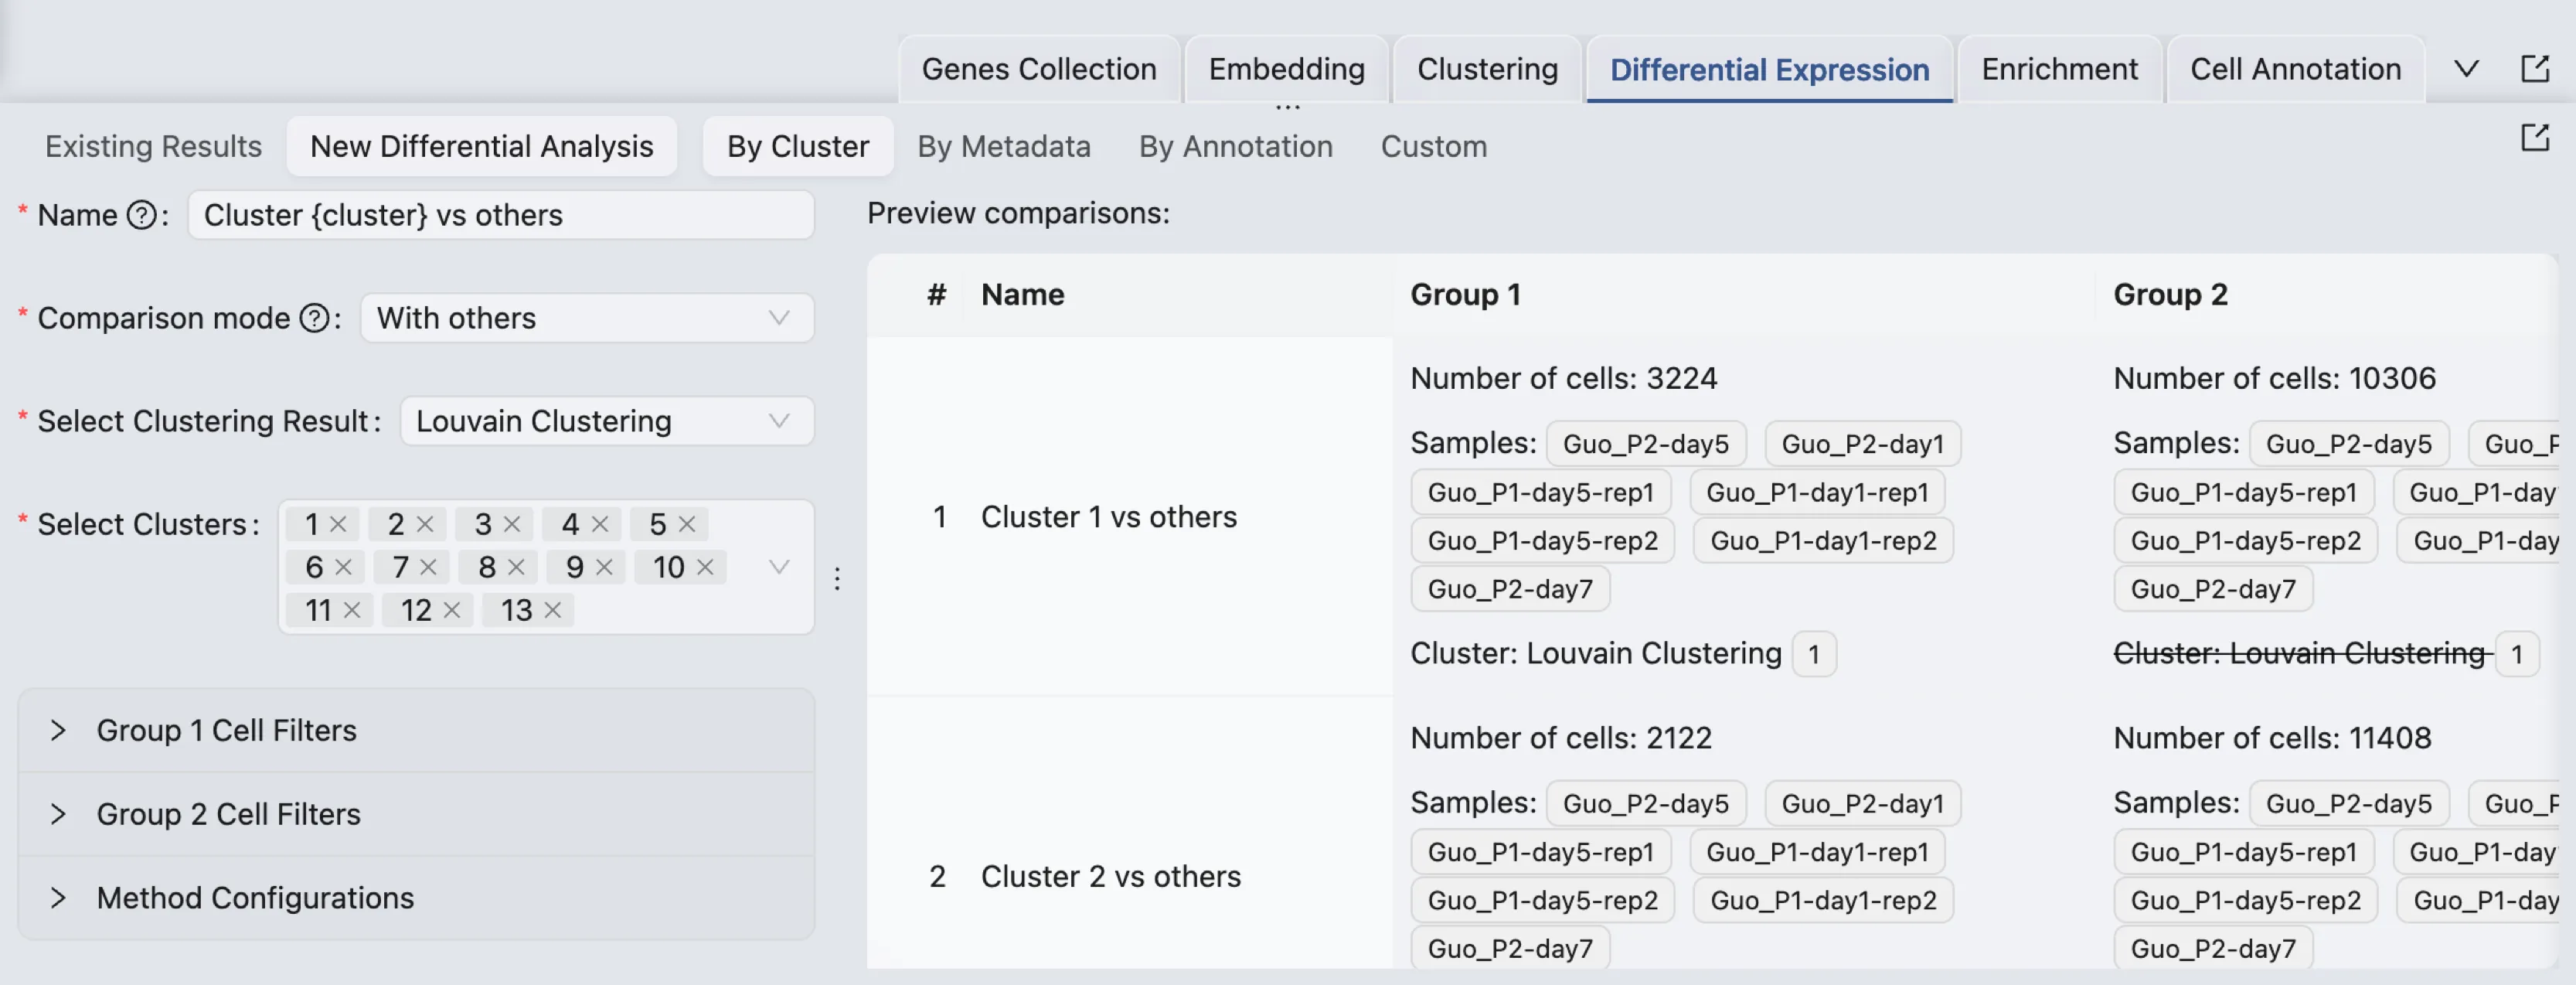
To access the Differential Expression Analysis panel, click on the Differential Expression tab on the Data and Analysis Panel.
Workflow
New Differential Expression Analysis
To open the form to create a new differential expression analysis, click on the New Differential Analysis button. By default, the analysis type is set to One cluster versus all others.
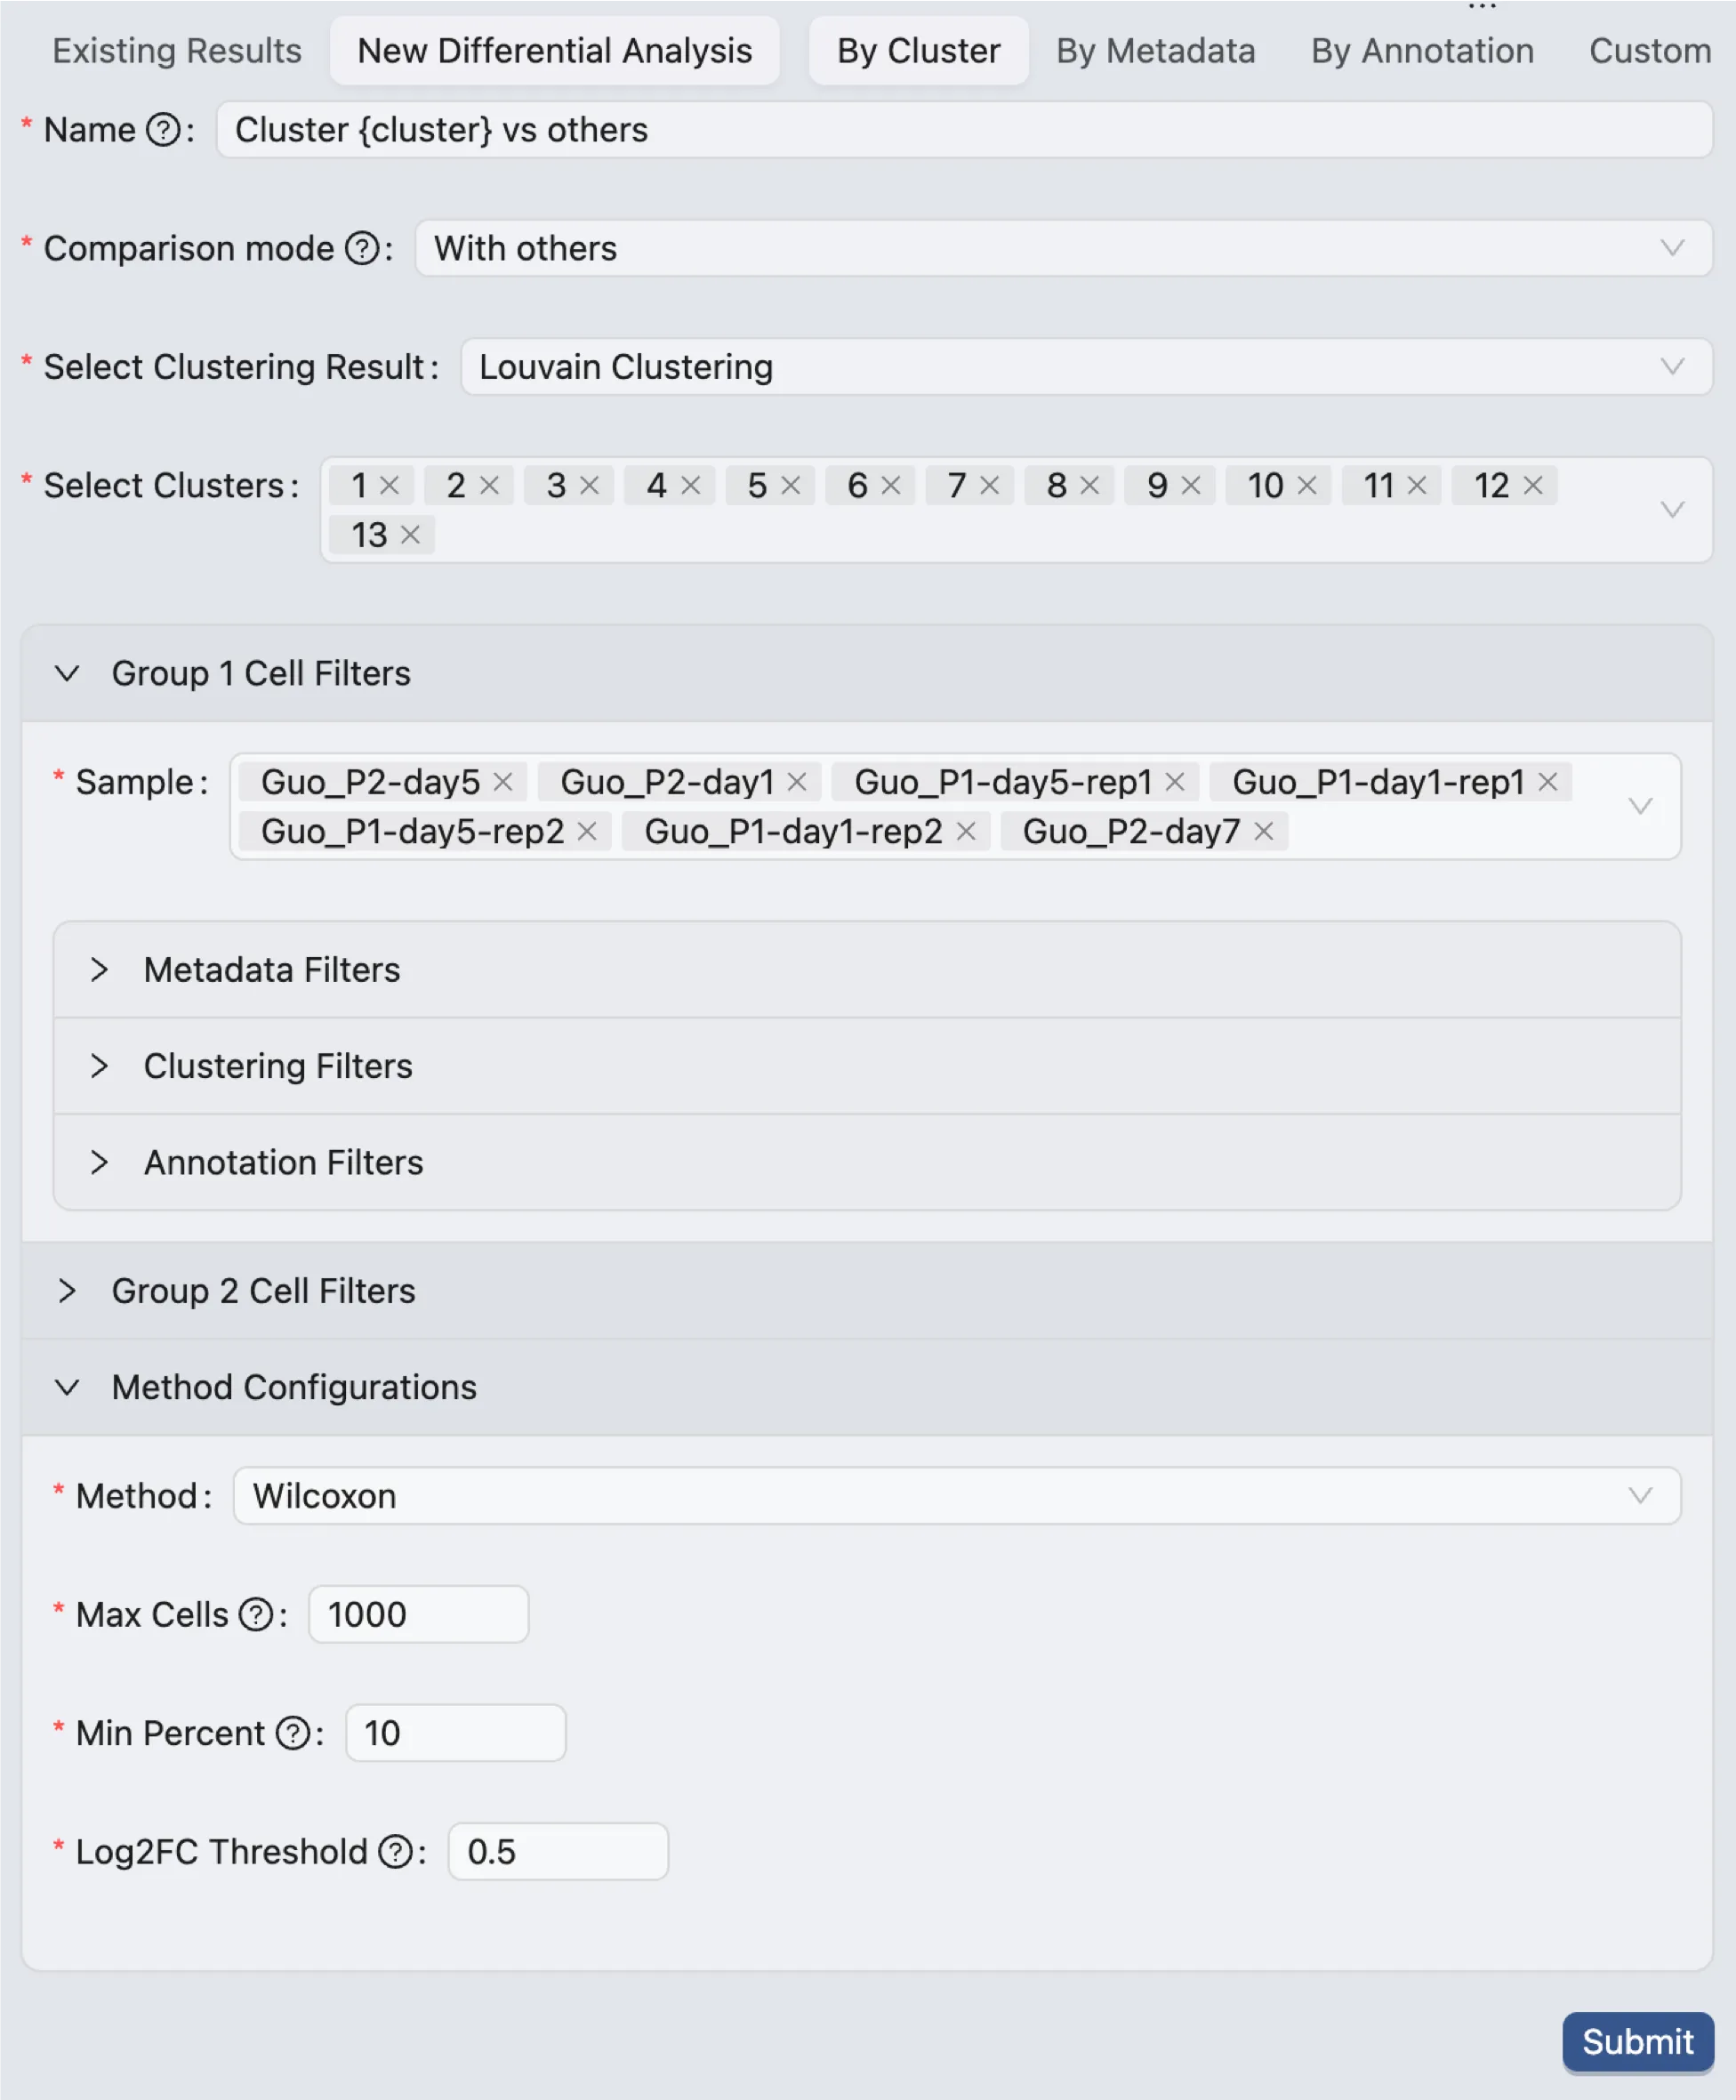
The form to create a new differential expression analysis consists of the following components:
Analysis Type: Select the type of analysis you want to perform. The options are By Cluster, By Metadata, By Annotation, and Custom.
Name: Enter a name for the analysis. When the analysis type is By Cluster,
{cluster}will be replaced by the selected cluster name. Similarly,{metadata}and{annotation}will be replaced by the selected metadata field and annotation. For example, if you select the analysis type as By Cluster and you select the clusters1and2. If the name is entered asDE {cluster}, the two analyses will be named asDE 1andDE 2.Comparison Mode: Select the comparison mode as With others or Within.
With others: Compare the selected group against all other groups in the selected category.
Within: Compare the selected groups within the selected category.
If this option is selected, you need to add additional filters to define the groups. See the details for cell filters below.
Select Clustering Result, Select Metadata Field, Select Annotation: These options are available based on the selected analysis type. Select the appropriate values for the analysis.
Select Clusters, Select Metadata Value, Select Annotation Value: These options are available based on the selected analysis type. Select the appropriate values for the analysis.
Regardless of the comparison mode, you can select multiple clusters, metadata values, or annotation values to compare. For each selected value, a separate analysis will be performed.
When the comparison mode is Within:
You need to add additional filters to define the groups. See the details for cell filters below.
For example, if you select clusters
1,2, and3, and you add a filter to defineGroup 1as cells with metadata fielddisease_statusisDisease, andGroup 2as cells with metadata fielddisease_statusisHealthy, three analyses will be performed:1 (Disease) vs 1 (Healthy),2 (Disease) vs 2 (Healthy), and3 (Disease) vs 3 (Healthy).
Cell Filters
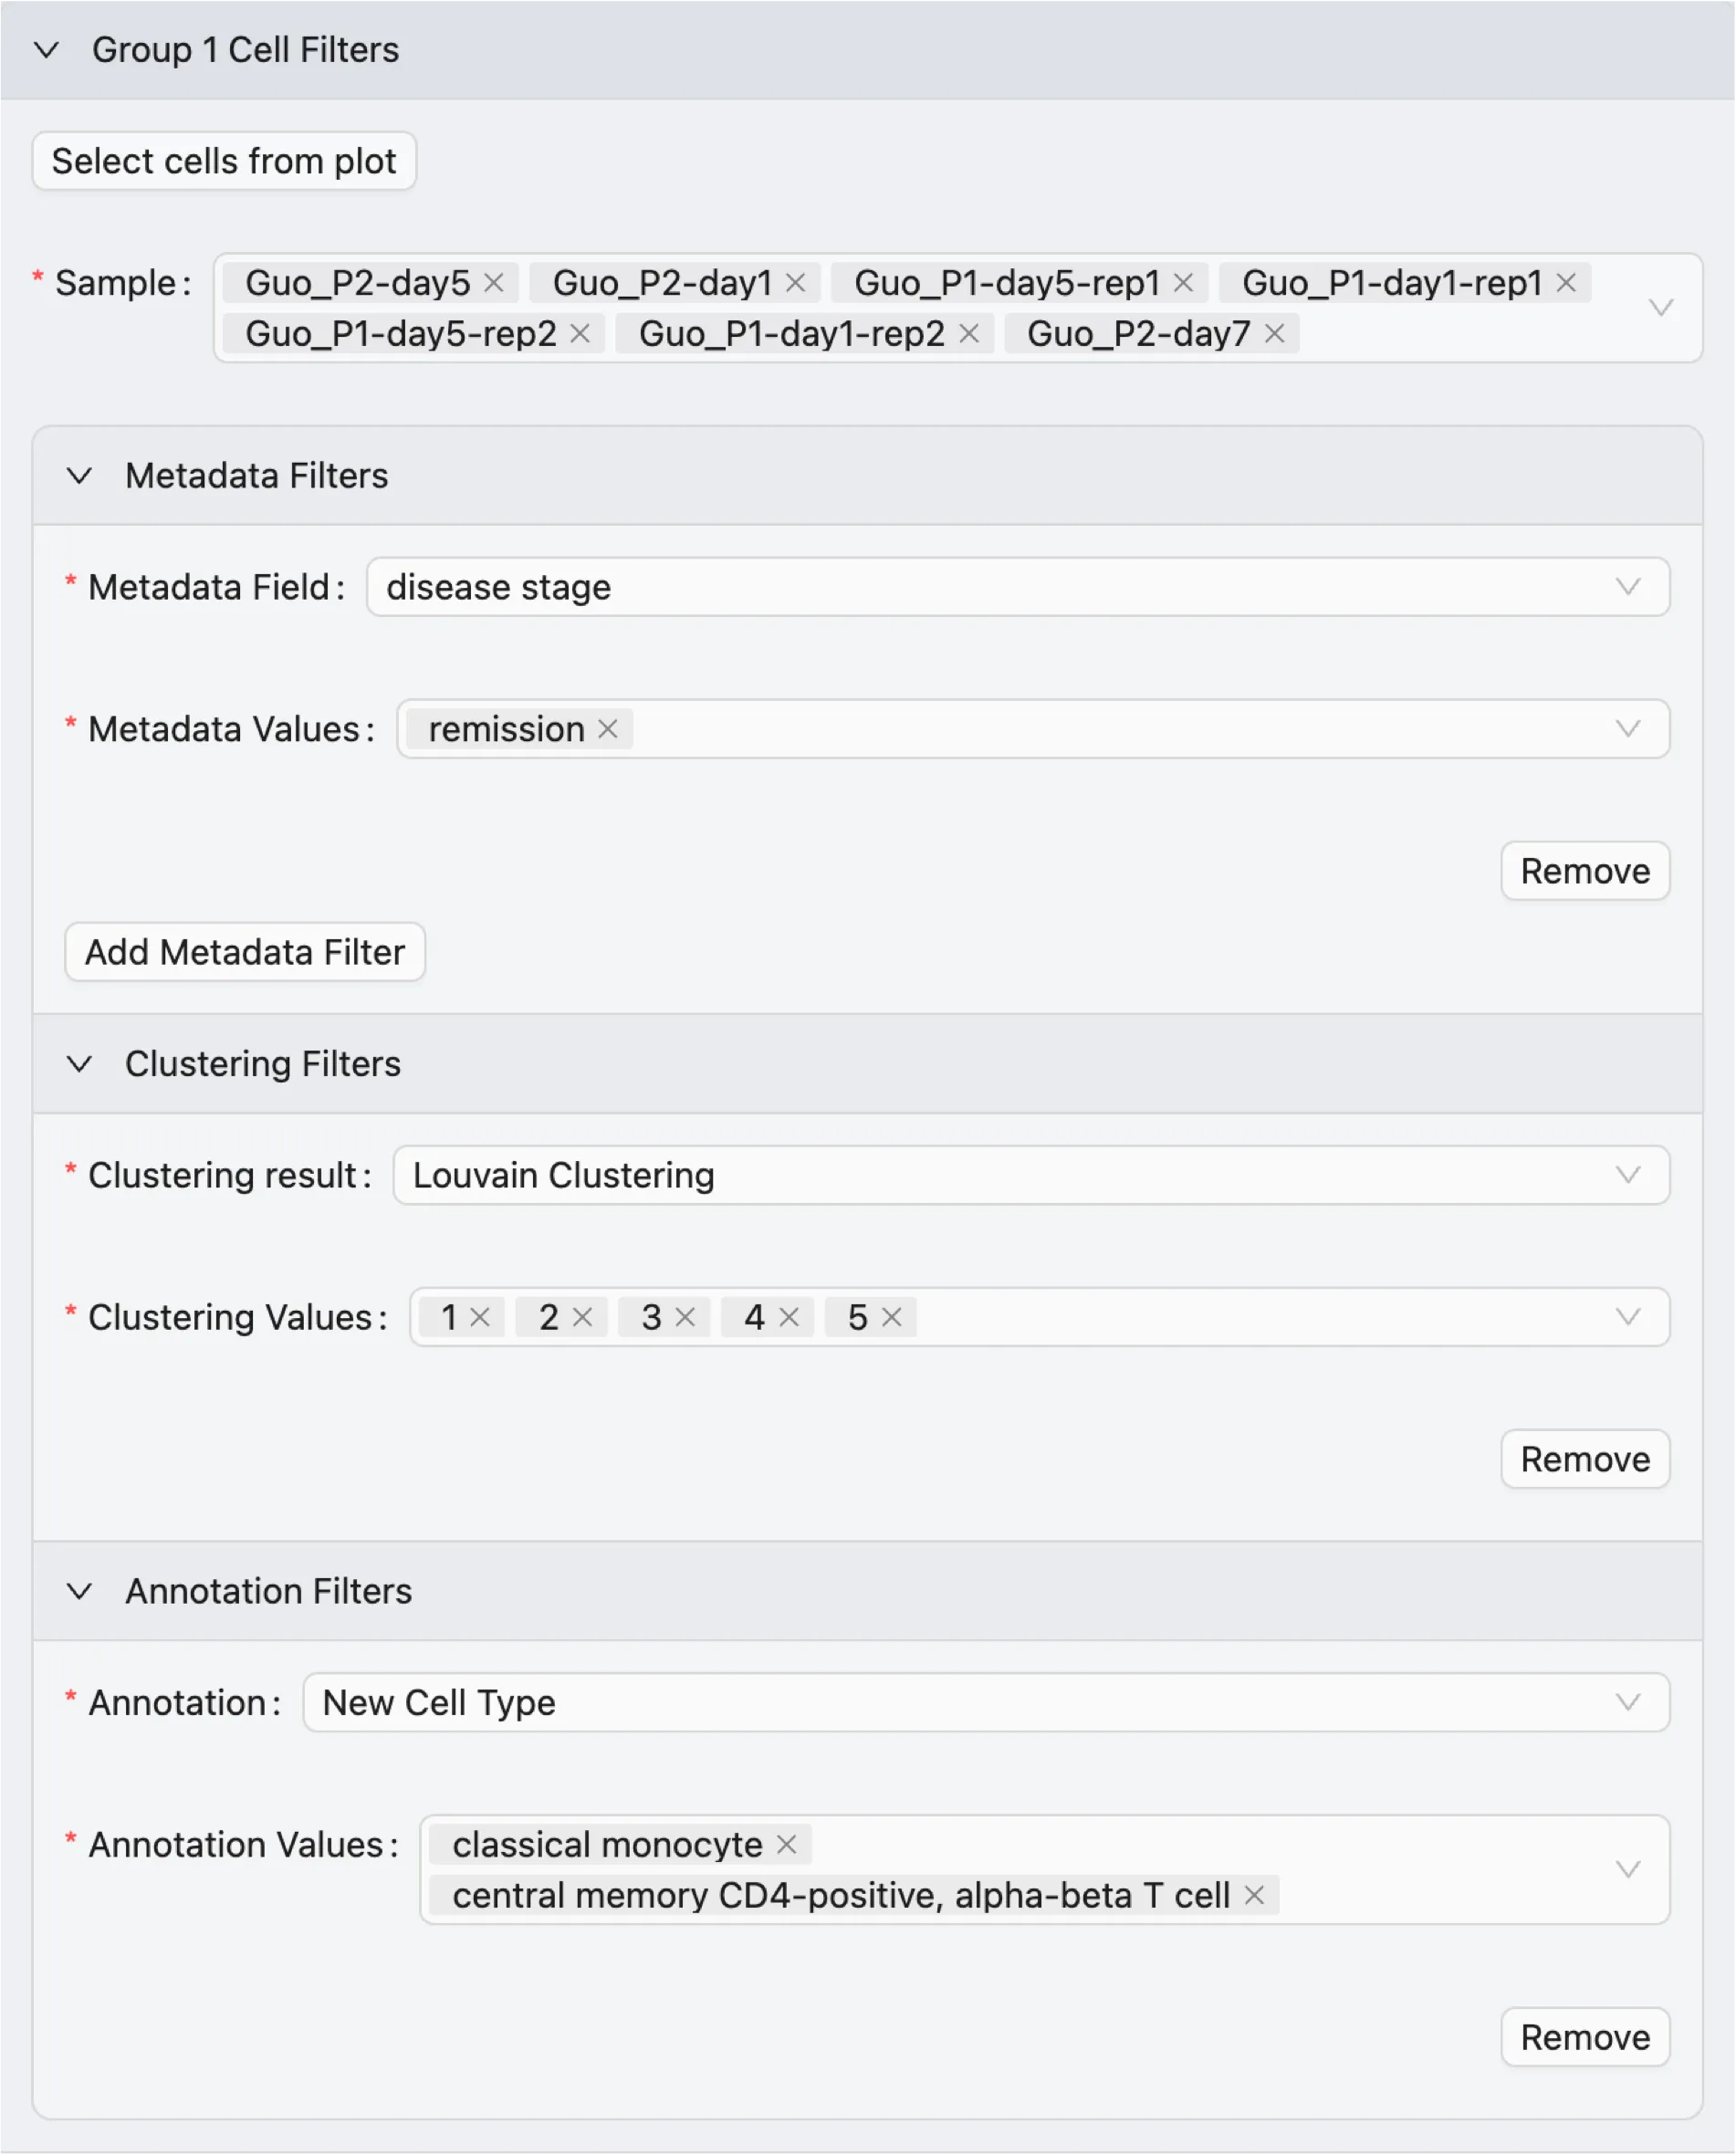
To add cell filters to define the groups for the analysis:
Expand
Group 1 Cell Filtersand/orGroup 2 Cell Filtersto view the available filters.The options for cell filters for each group are:
Select cells from plot: Select cells from a visualization plot to include in the analysis. This will enable a brush selection, so you can select cells from a visualization plot.
Sample: Only include cells from the selected samples for this group.
Metadata Filters: Add metadata filters to include cells based on metadata values.
Select Metadata Field and Metadata Values to filter cells based on metadata.
Only cells that have the selected metadata field and values will be included in this group.
You can add multiple metadata filters to further refine the selection by clicking on the Add Metadata Filter button.
Clustering Filters and Annotation Filters: Add filters to include cells based on clustering results or annotations. Similar to metadata filters, you can select the clustering result or annotation and the values to filter cells.
A detailed explanation of the cell filters is available in the Cell Filtering documentation.
Method and Parameters
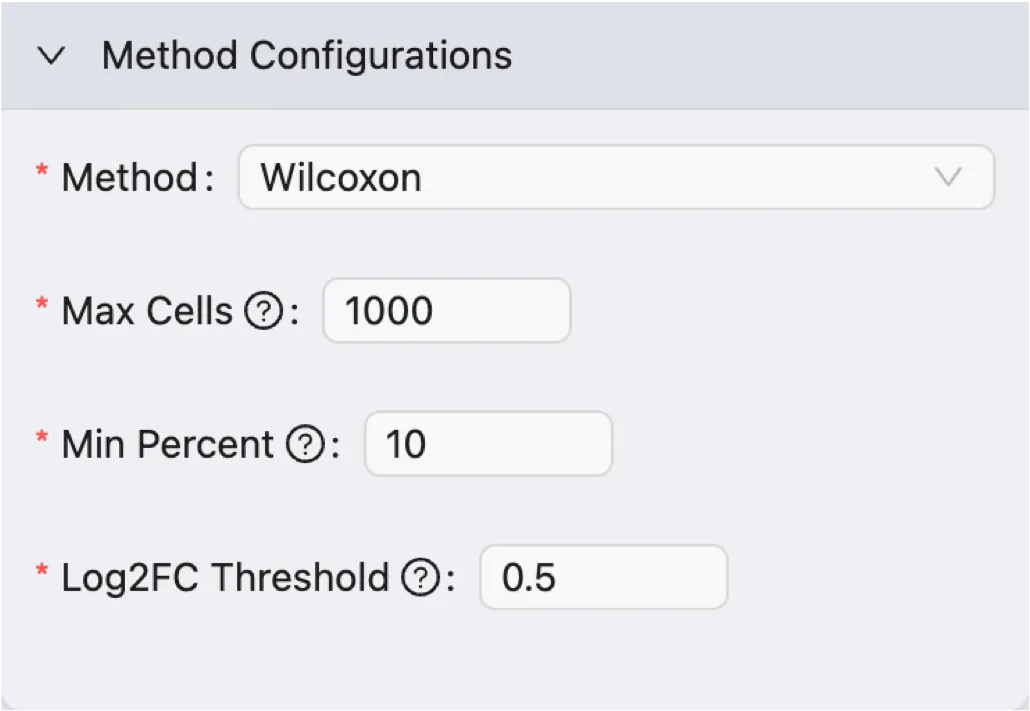
Select the method and parameters for the differential expression analysis:
Method: Select the method to perform the differential expression analysis. The options are
Wilcoxon Rank Sum TestandMAST.Max Cells: The maximum number of cells to use for the analysis. If the number of cells in the selected groups exceeds this value, a random subset of cells will be used for the analysis.
Min Percent: Only genes that are expressed in at least this percentage of cells will be included in the analysis.
Log Fold Change: Only genes with a log fold change greater than this value will be included in the results.
Preview
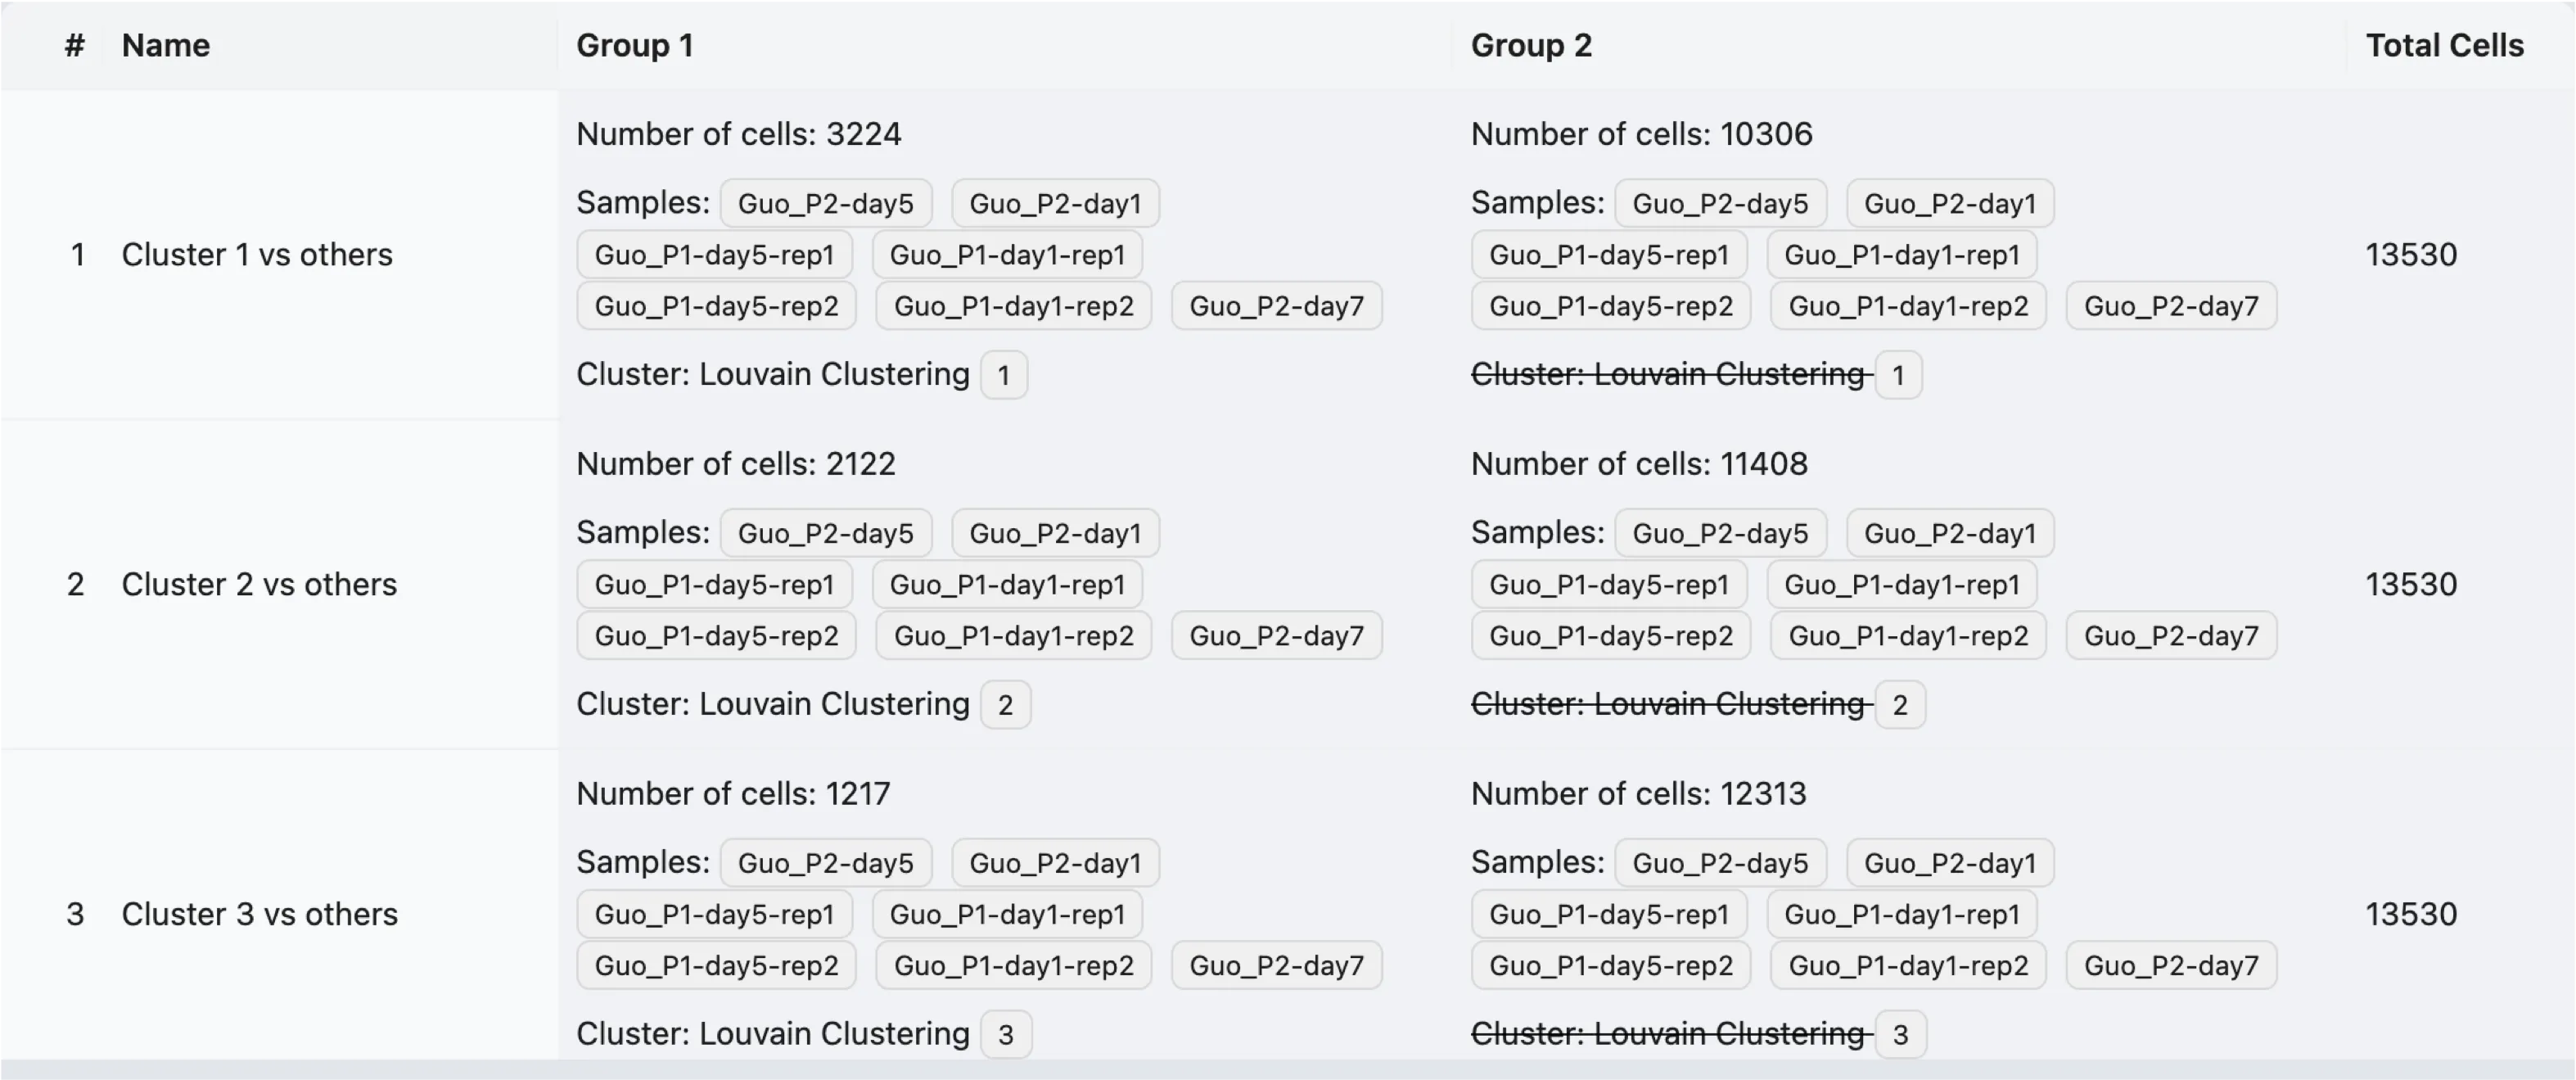
After selecting the clusters, metadata values, annotation values, or adding cell filters, you can preview the analyses that will be performed.
In this preview table, you can see the details of the analyses that will be performed:
Name: The name of the analysis.
Group 1: The number of cells, selected clusters, metadata values, annotation values, or cell filters for Group 1.
Group 2: The number of cells, selected clusters, metadata values, annotation values, or cell filters for Group 2.
Total Cells: The total number of cells that will be included in the analysis.
In the preview table, a strike-through indicates that the filter is to exclude cells. For example, Louvain Clustering 1 means that cells belonging to Louvain Clustering 1 will be excluded from the group.
Once you verify the analyses, click on the Submit button to perform the differential expression analysis.
Differential Expression Results
Existing Differential Expression Analyses
Click on Existing Results to view the list of existing differential expression analyses.
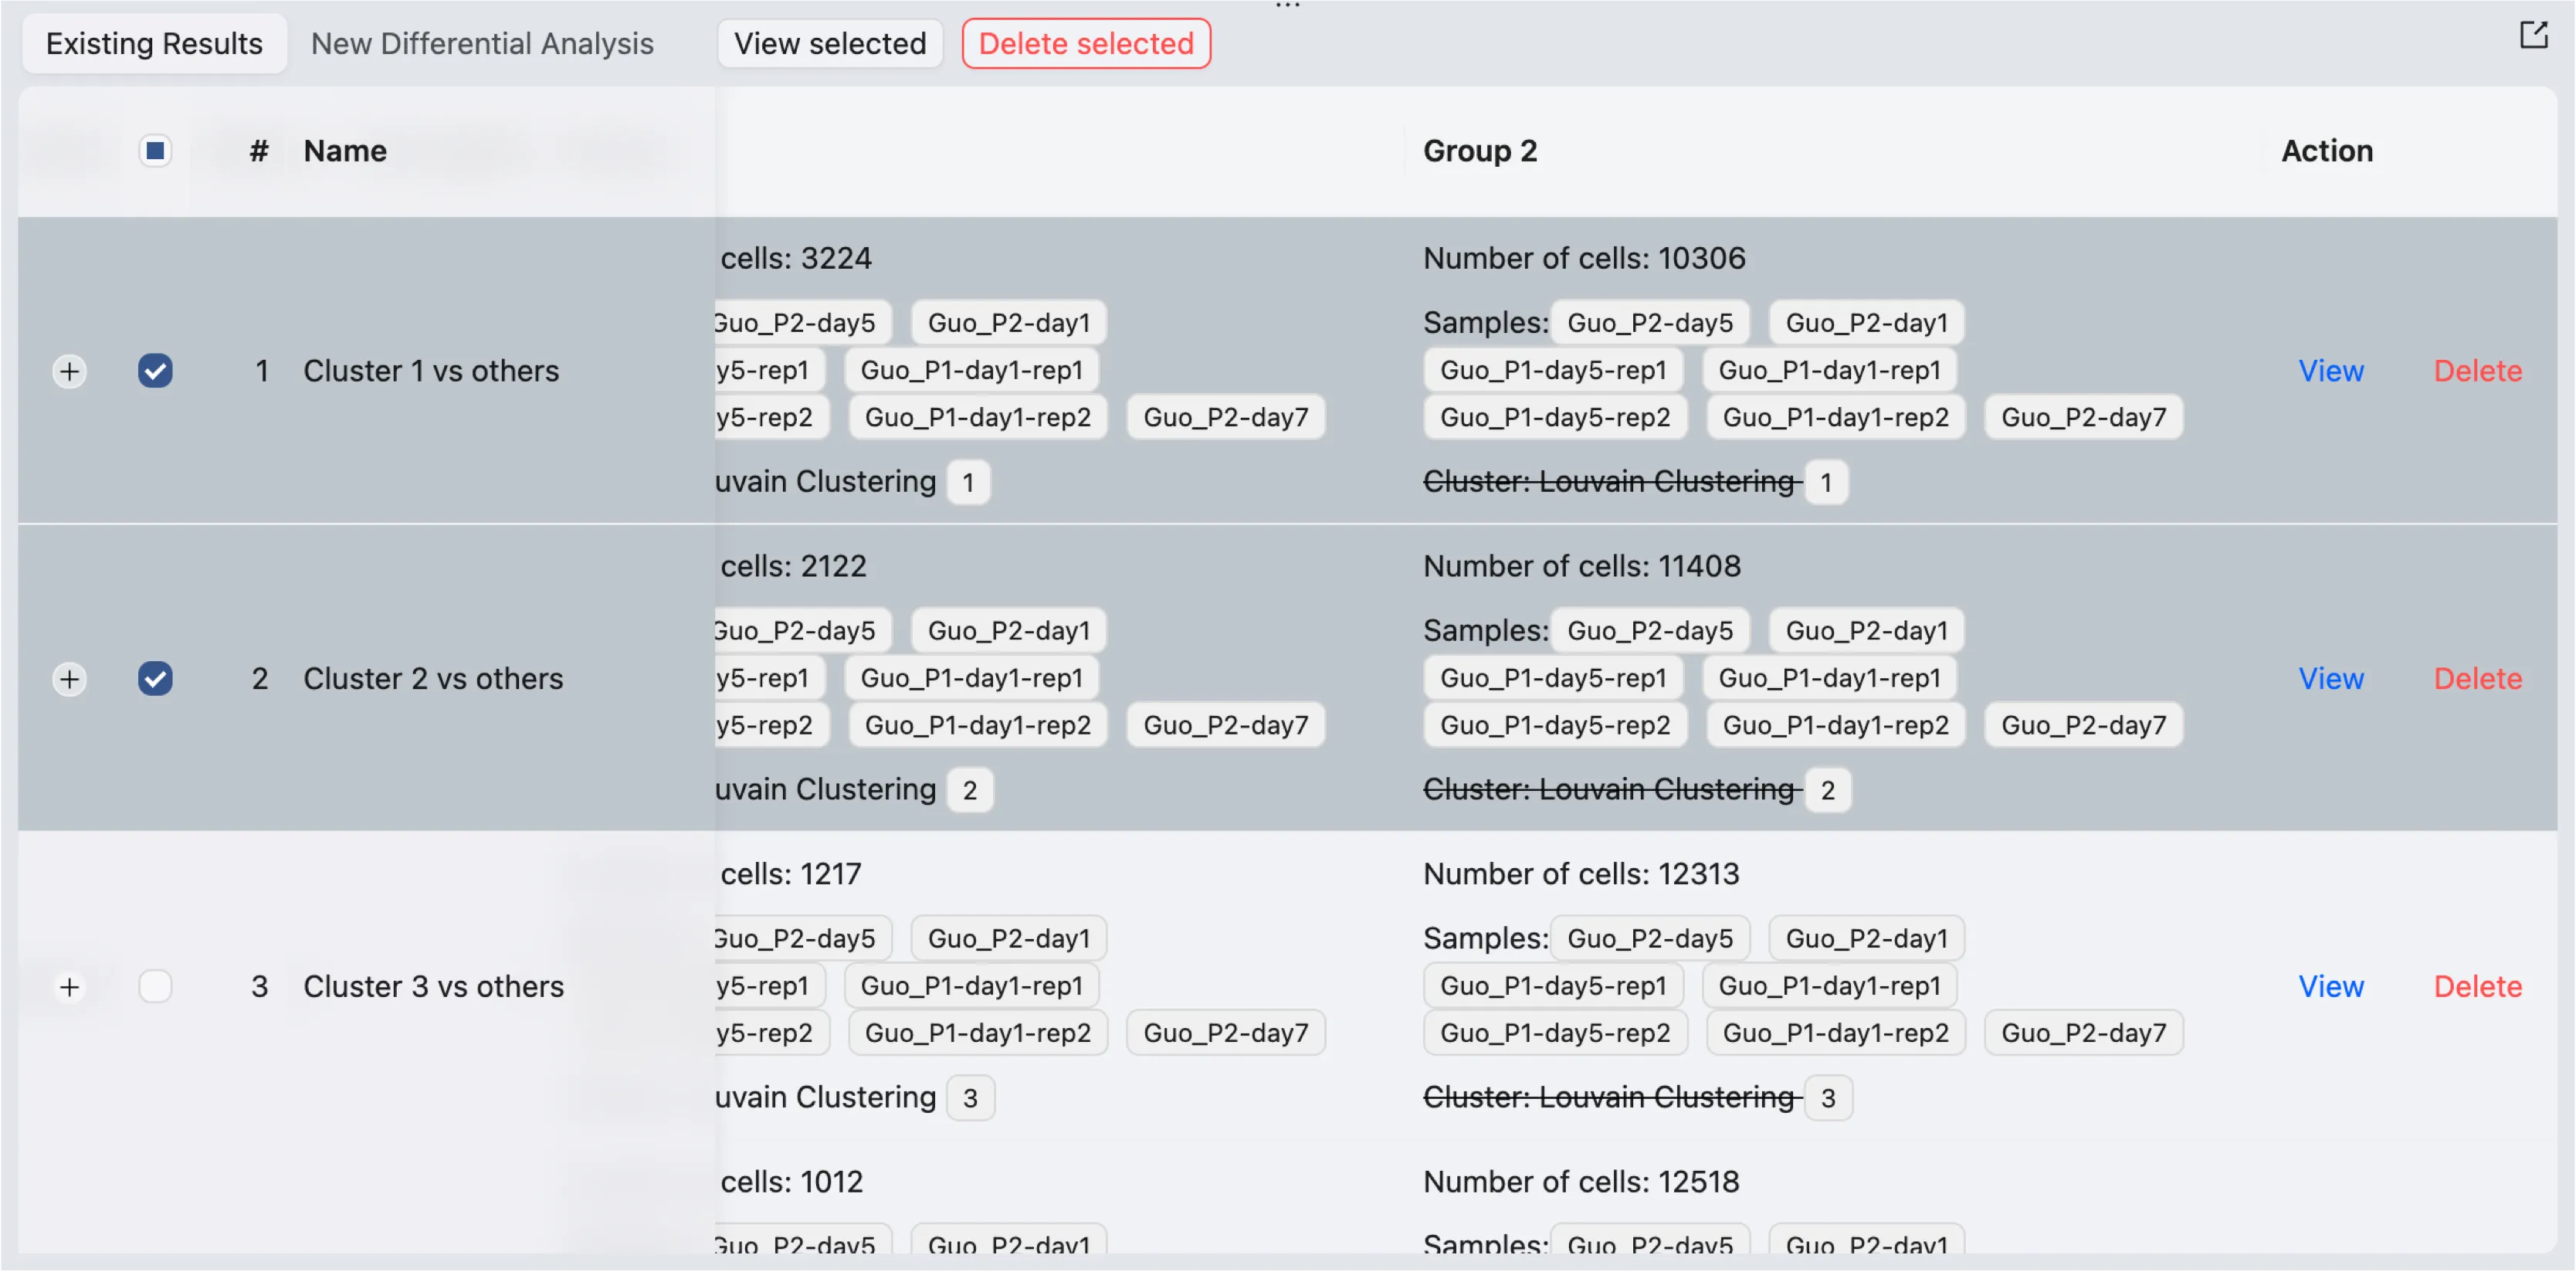
A table will display the existing differential expression analyses with the following information:
Name: The name of the analysis.
Method: The method used for the analysis.
Group 1: The information about group 1 for the analysis.
Group 2: The information about group 2 for the analysis.
To view the results:
Click on the
Viewbutton to view the results of a specific analysis.Select one or more analyses using the checkboxes on the left side of the table, then click the button
View Selectedon top of the table to view the selected results in the same window.
Differential Expression Results View Page
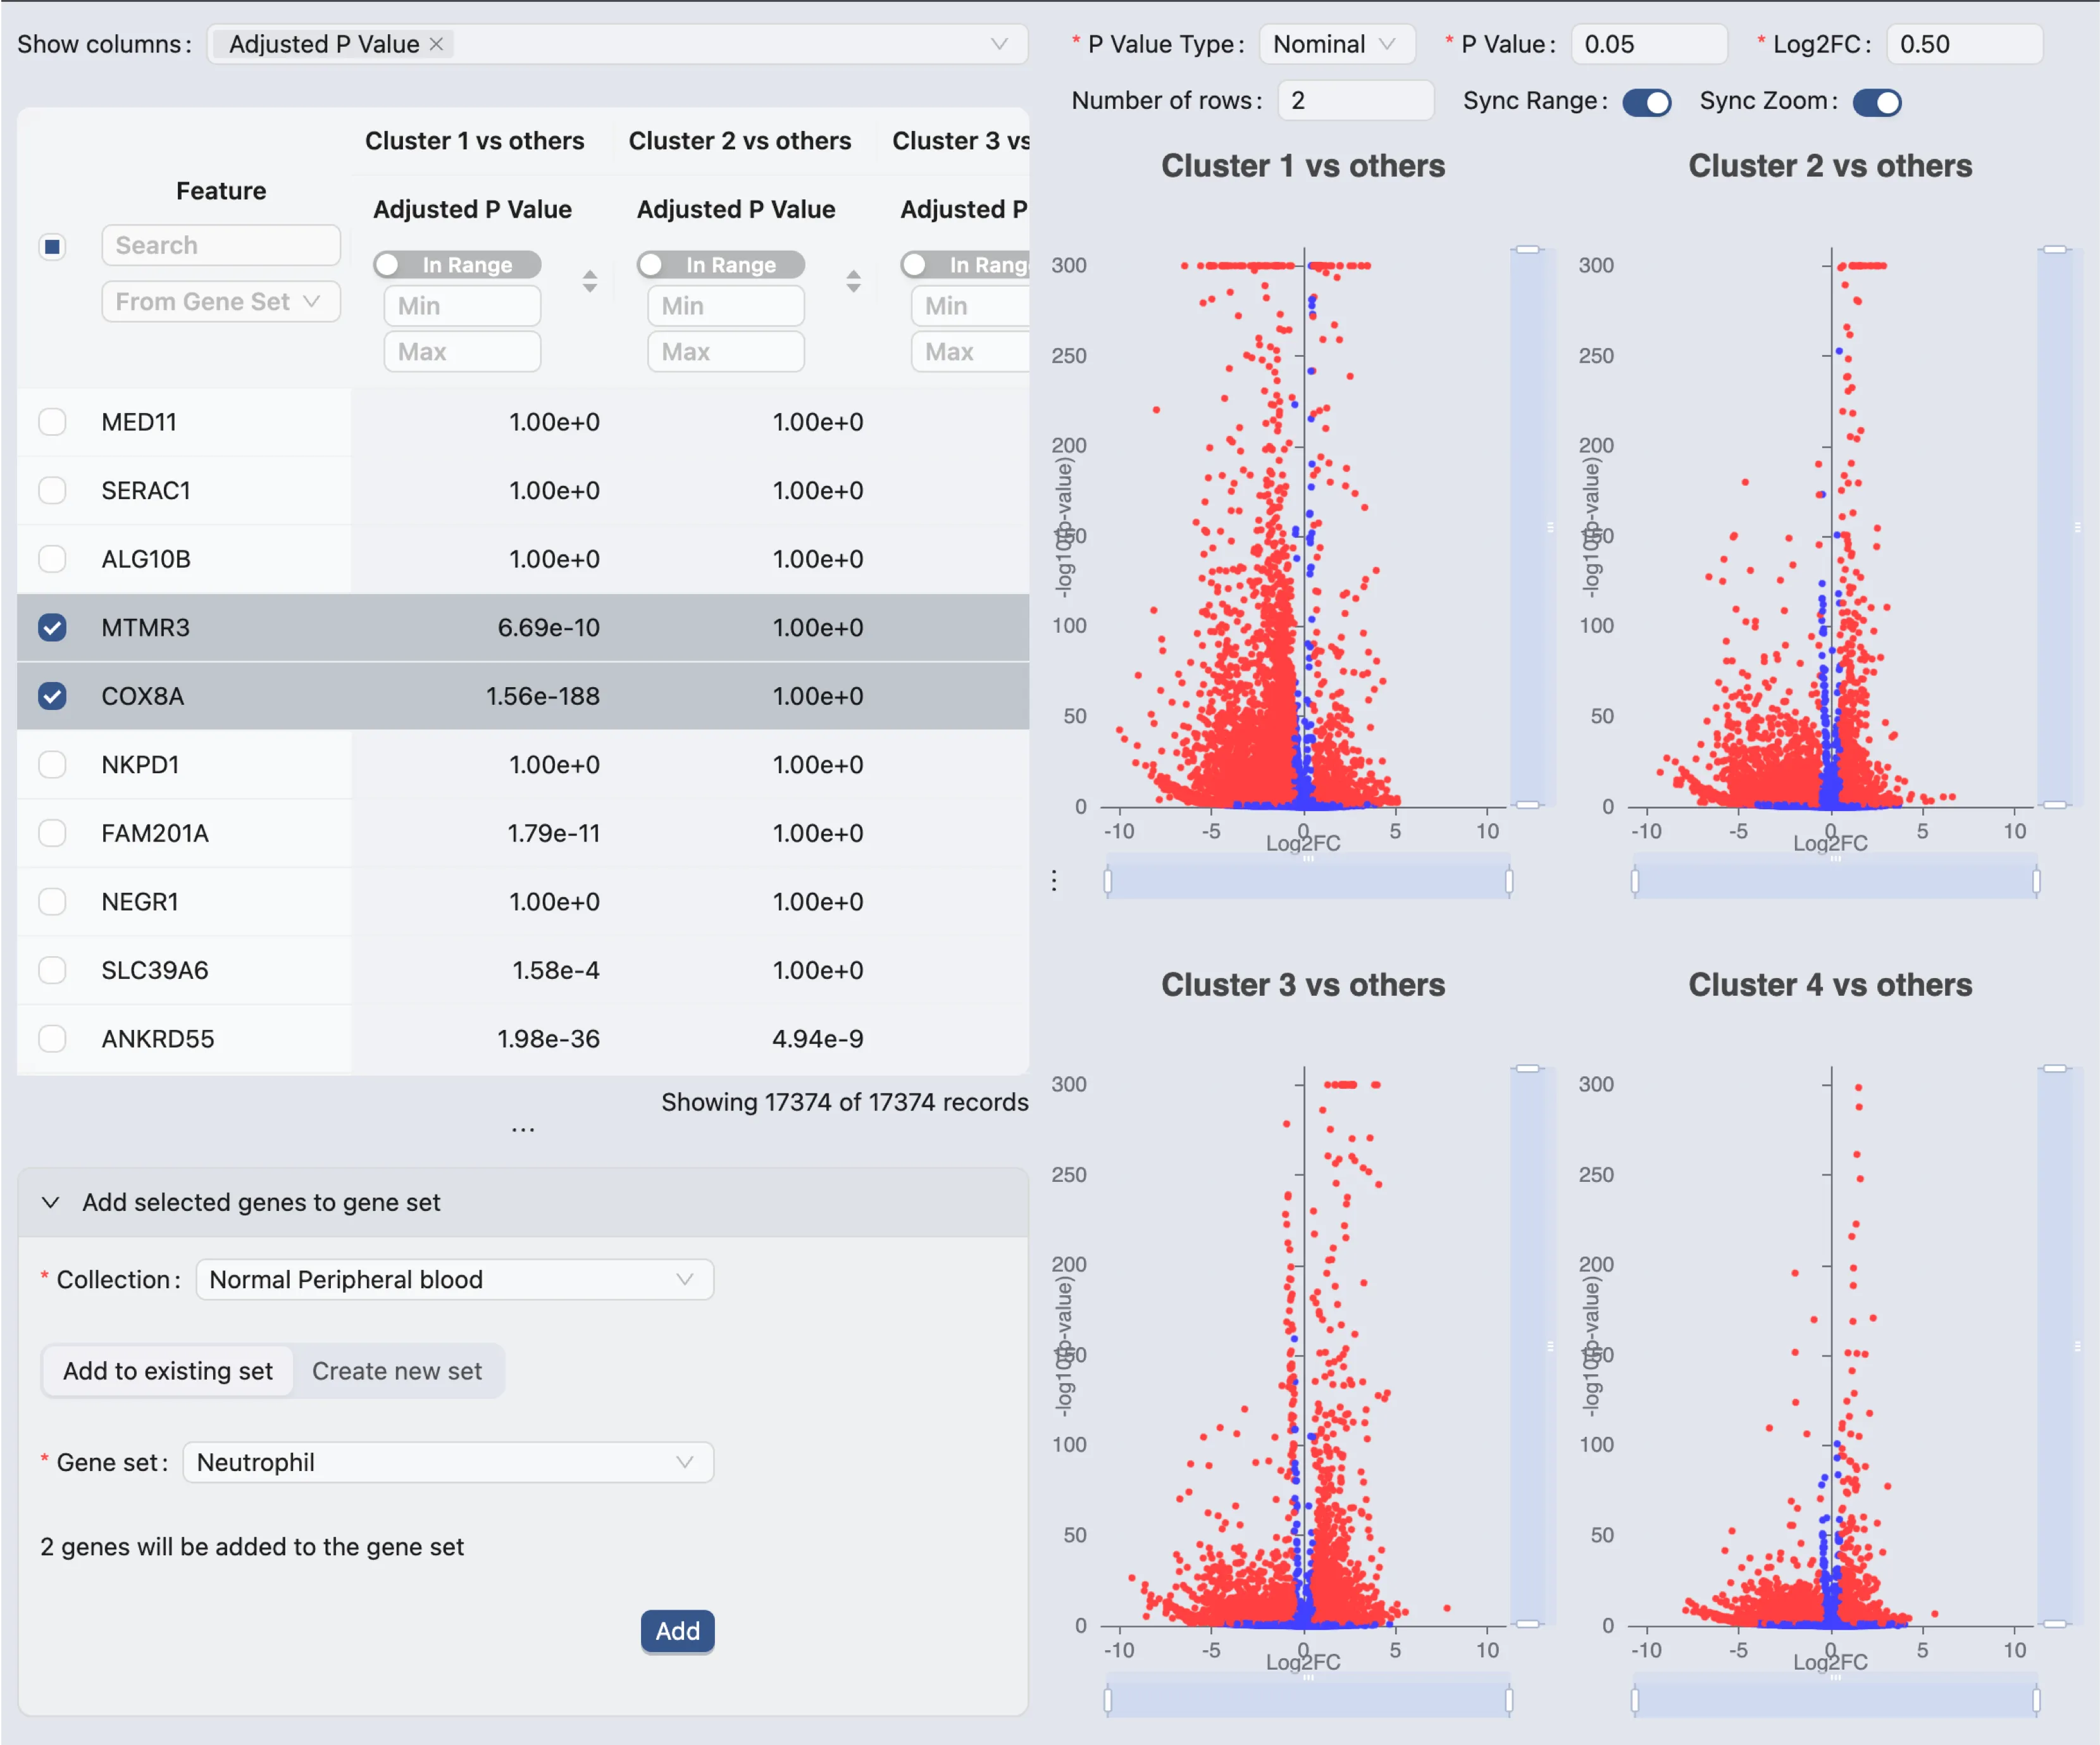
On the differential expression results view page, you will see the following components:
Results Table with the following columns:
Feature: The gene name.
P-value: The p-value of the differential expression.
Adjusted P-value: The adjusted p-value of the differential expression.
Log Fold Change: The log fold change of the differential expression.
Mean Expression Group 1: The mean expression of the gene in Group 1.
Mean Expression Group 2: The mean expression of the gene in Group 2.
Percentage of Cells Group 1: The percentage of cells expressing the gene in Group 1.
Percentage of Cells Group 2: The percentage of cells expressing the gene in Group 2.
If you select to view multiple analyses, each analysis will be displayed in a separate group of columns within the table. You can hide or show the columns for each analysis by using the
Show Columnsdropdown menu.Volcano Plots: The volcano plots for each analysis. The volcano plot shows the log fold change on the x-axis and the -log10 of the p-value on the y-axis. The genes that are significantly differentially expressed are highlighted in the plot.
You can hover over the points in the plot to see the gene name and the log fold change.
You can zoom in and out of the plot using the mouse scroll wheel.
The top form allows you to:
Change the color of the points based on the adjusted p-value or log fold change.
Change the layout of the plots if you have multiple analyses.
Synchronize the range of the plots.
Synchronize the zoom level of the plots.
Add selected genes to Gene Set Collection: You can add the selected genes to a gene set collection by clicking on the
Add to Gene Set Collectionbutton. This will enable a form where you can select an existing gene set collection or create a new one.
Extract Differentially Expressed Genes and Add to Gene Set Collection
You can extract the differentially expressed genes from the results table and add them to a gene set collection as described above. Alternatively, you can select one or more DE results from the DE results table and click on the Extract DE Genes button to extract the differentially expressed genes from the selected analyses.
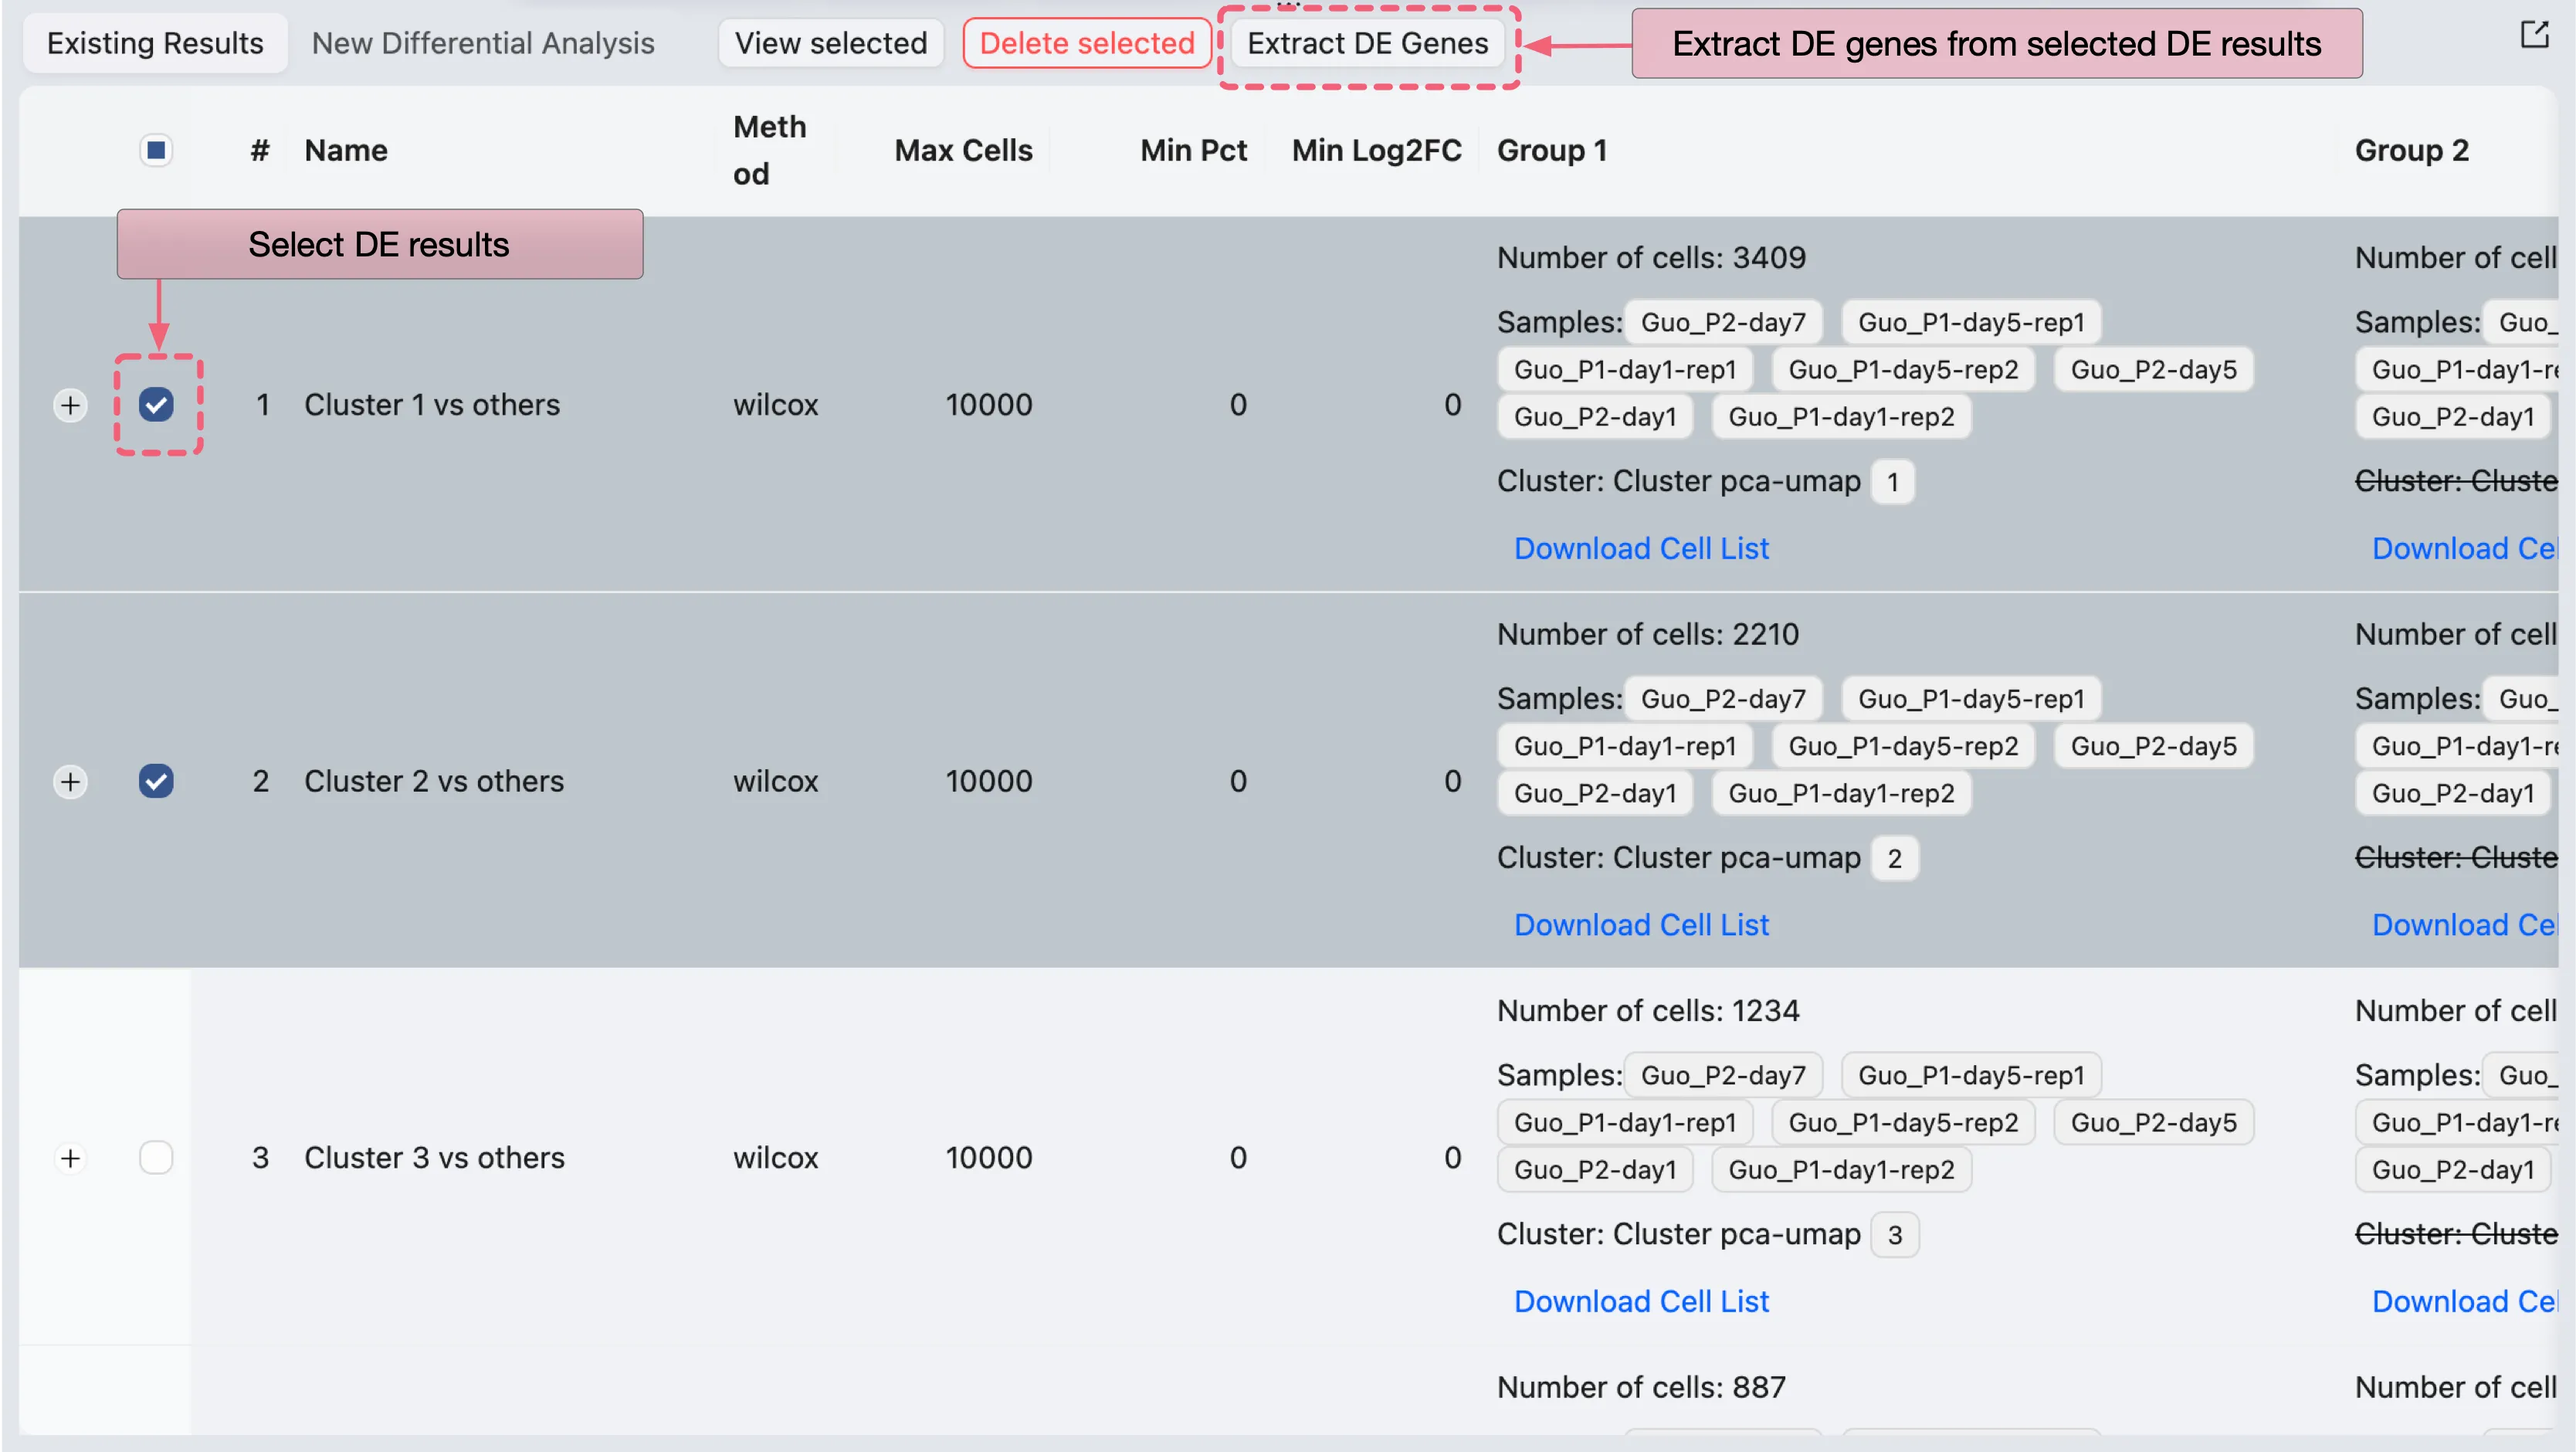
A dialog will open where you can specify parameters for the extraction process:
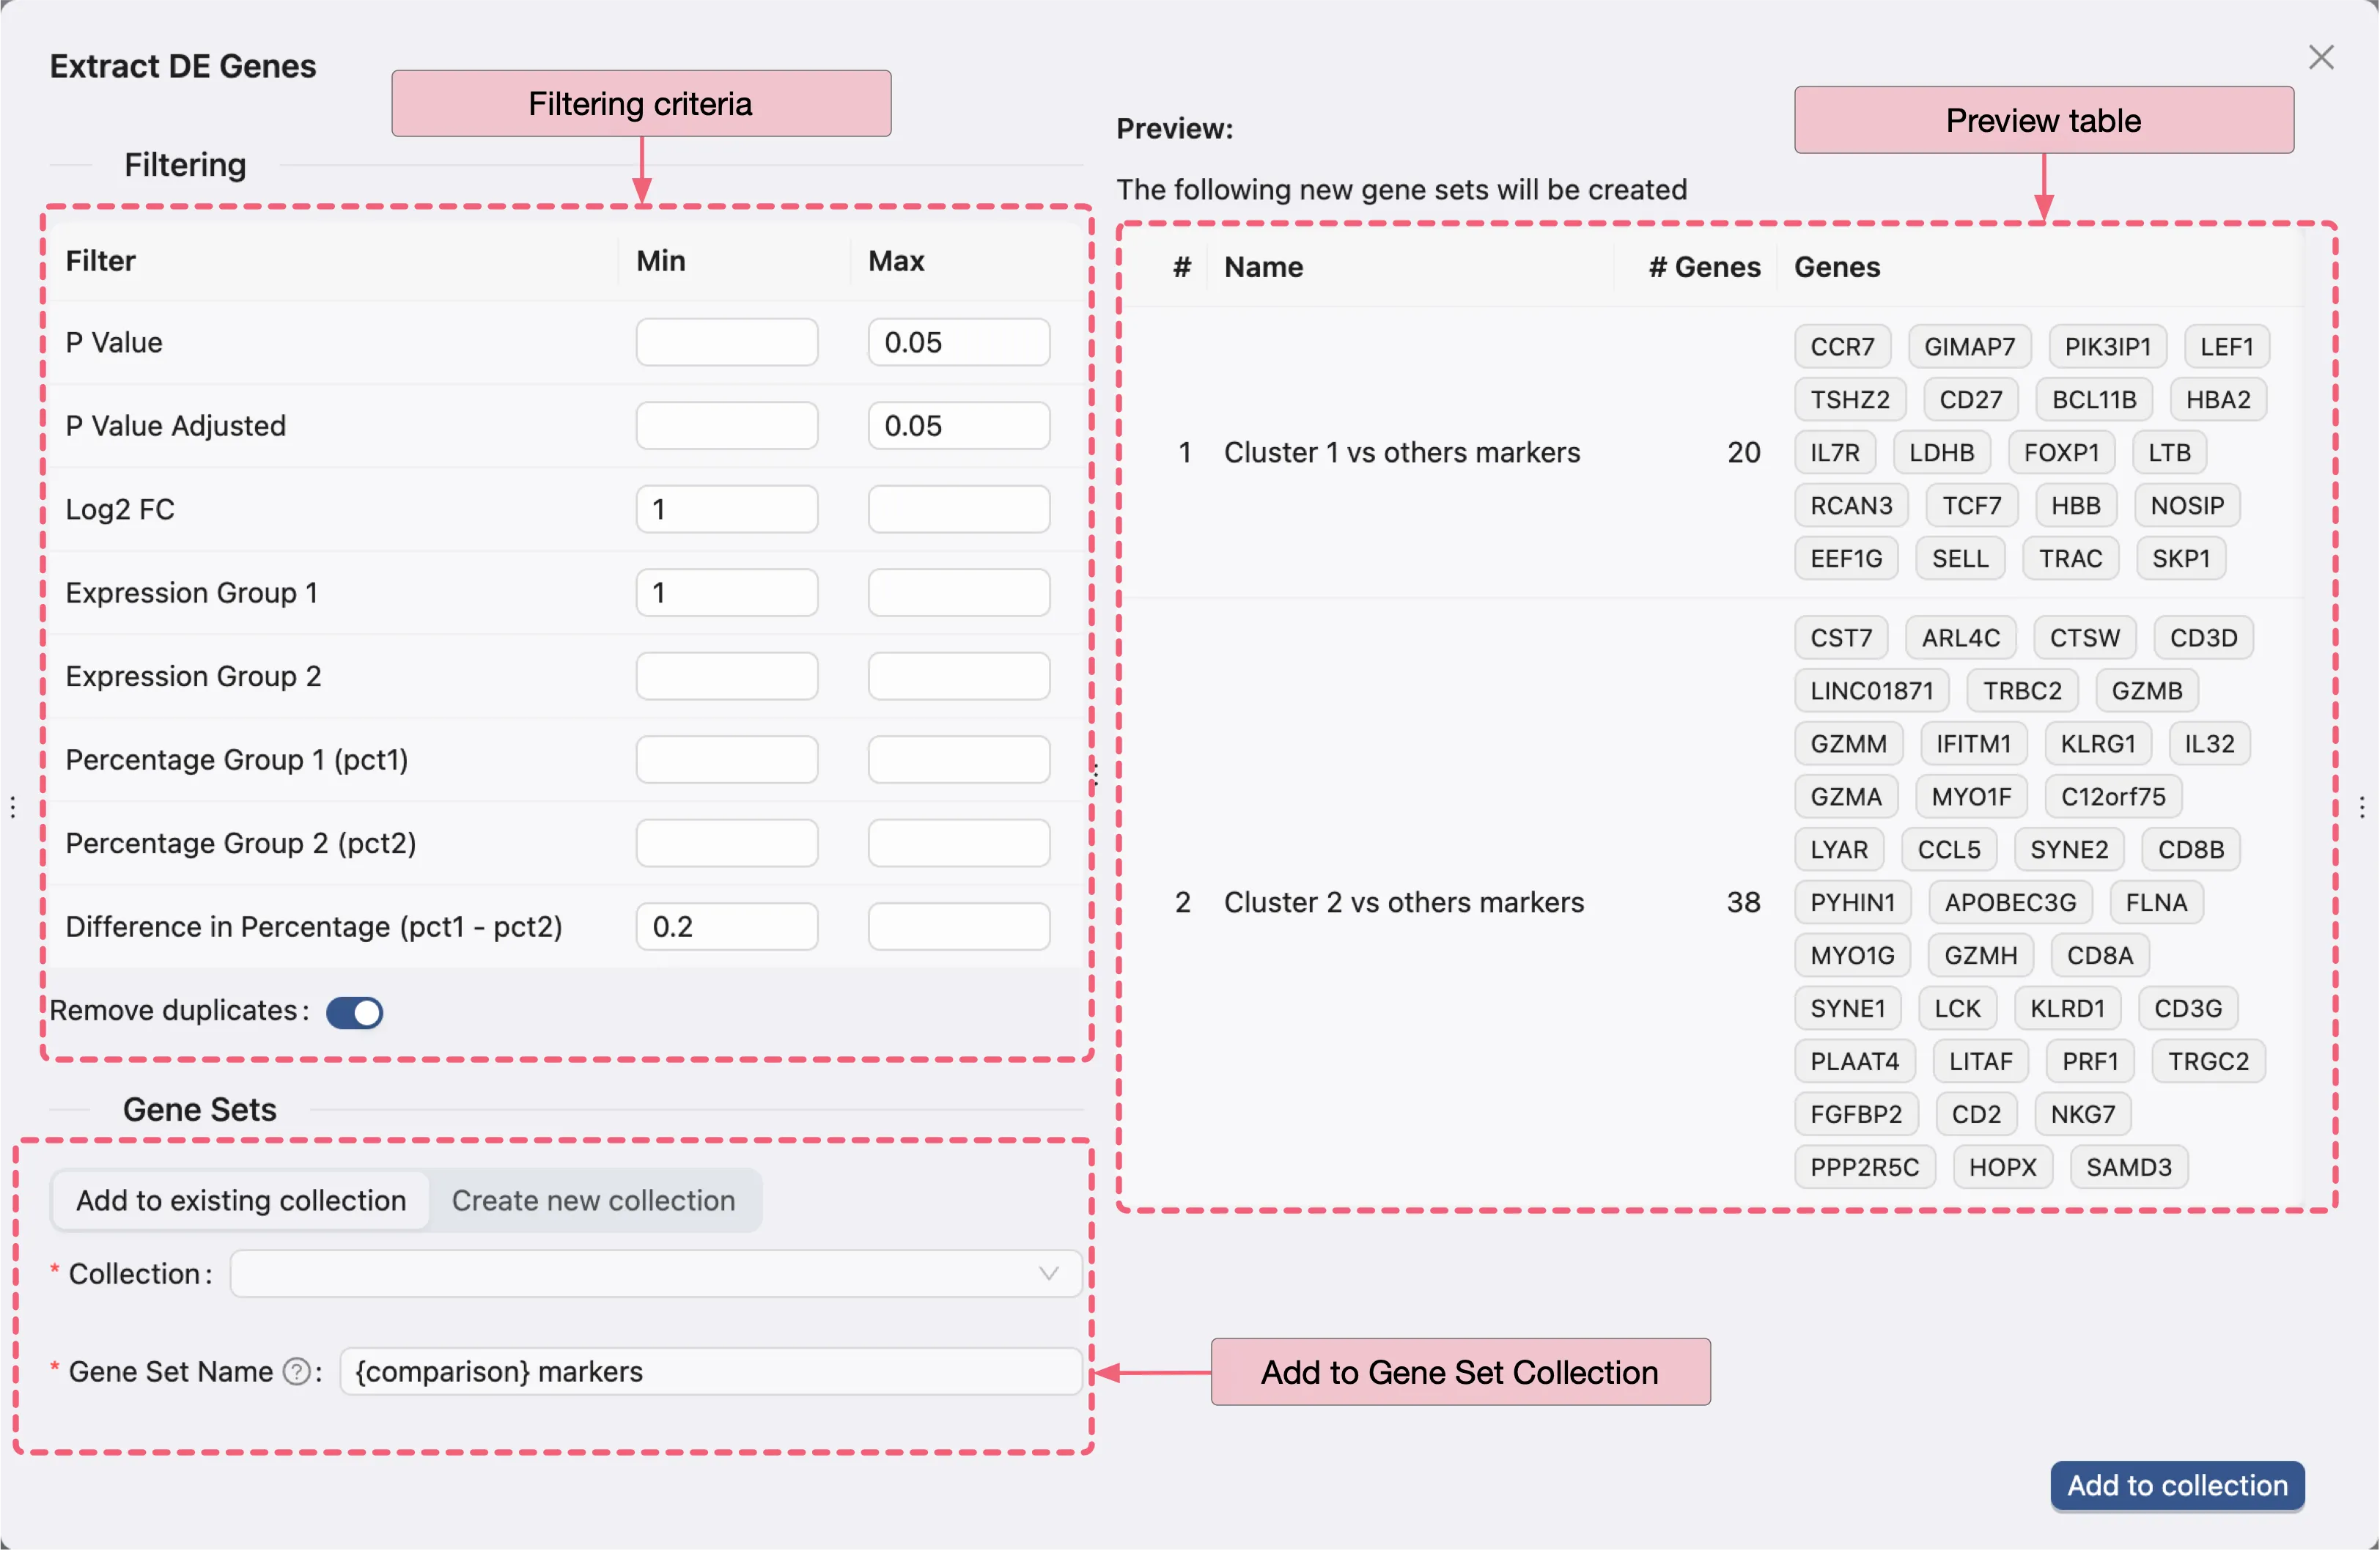
There are three main panels in the dialog:
Filtering criteria: Specify the filtering criteria used to extract the DE genes from the DE analysis results.
Preview table: Preview the extracted DE genes based on the filtering criteria for each analysis result.
Add to Gene Set Collection Form: You can add the extracted DE genes to an existing gene set collection or create a new one.
Finally, click Add to collection to add the extracted DE genes to the selected gene set collection.