Enrichment Analysis
Enrichment Analysis in CytoAnalyst
In CytoAnalyst, enrichment analysis is used to aid in cell annotation by calculating the enrichment of gene sets in cells or group of cells (grouped by metadata, clusters, or annotations). The results of enrichment analysis can be used to infer the biological functions of the cells or groups of cells.
Navigation
To access the Enrichment Analysis panel, click on the Enrichment tab on the Data and Analysis Panel.

Workflow
CytoAnalyst allows you to perform enrichment analysis using two methods:
By Cell: Perform enrichment analysis on individual cells.
From DE Analysis: Perform enrichment analysis using previously performed differential expression analysis results. To see how to perform differential expression analysis, see Differential Expression Analysis.
Using Cell Type Scoring: Perform cell type scoring using pretrained models.
Create New Enrichment Analysis
To open the form for creating a new enrichment analysis, click the New Enrichment button. Then select your preferred enrichment analysis method.
By Cell
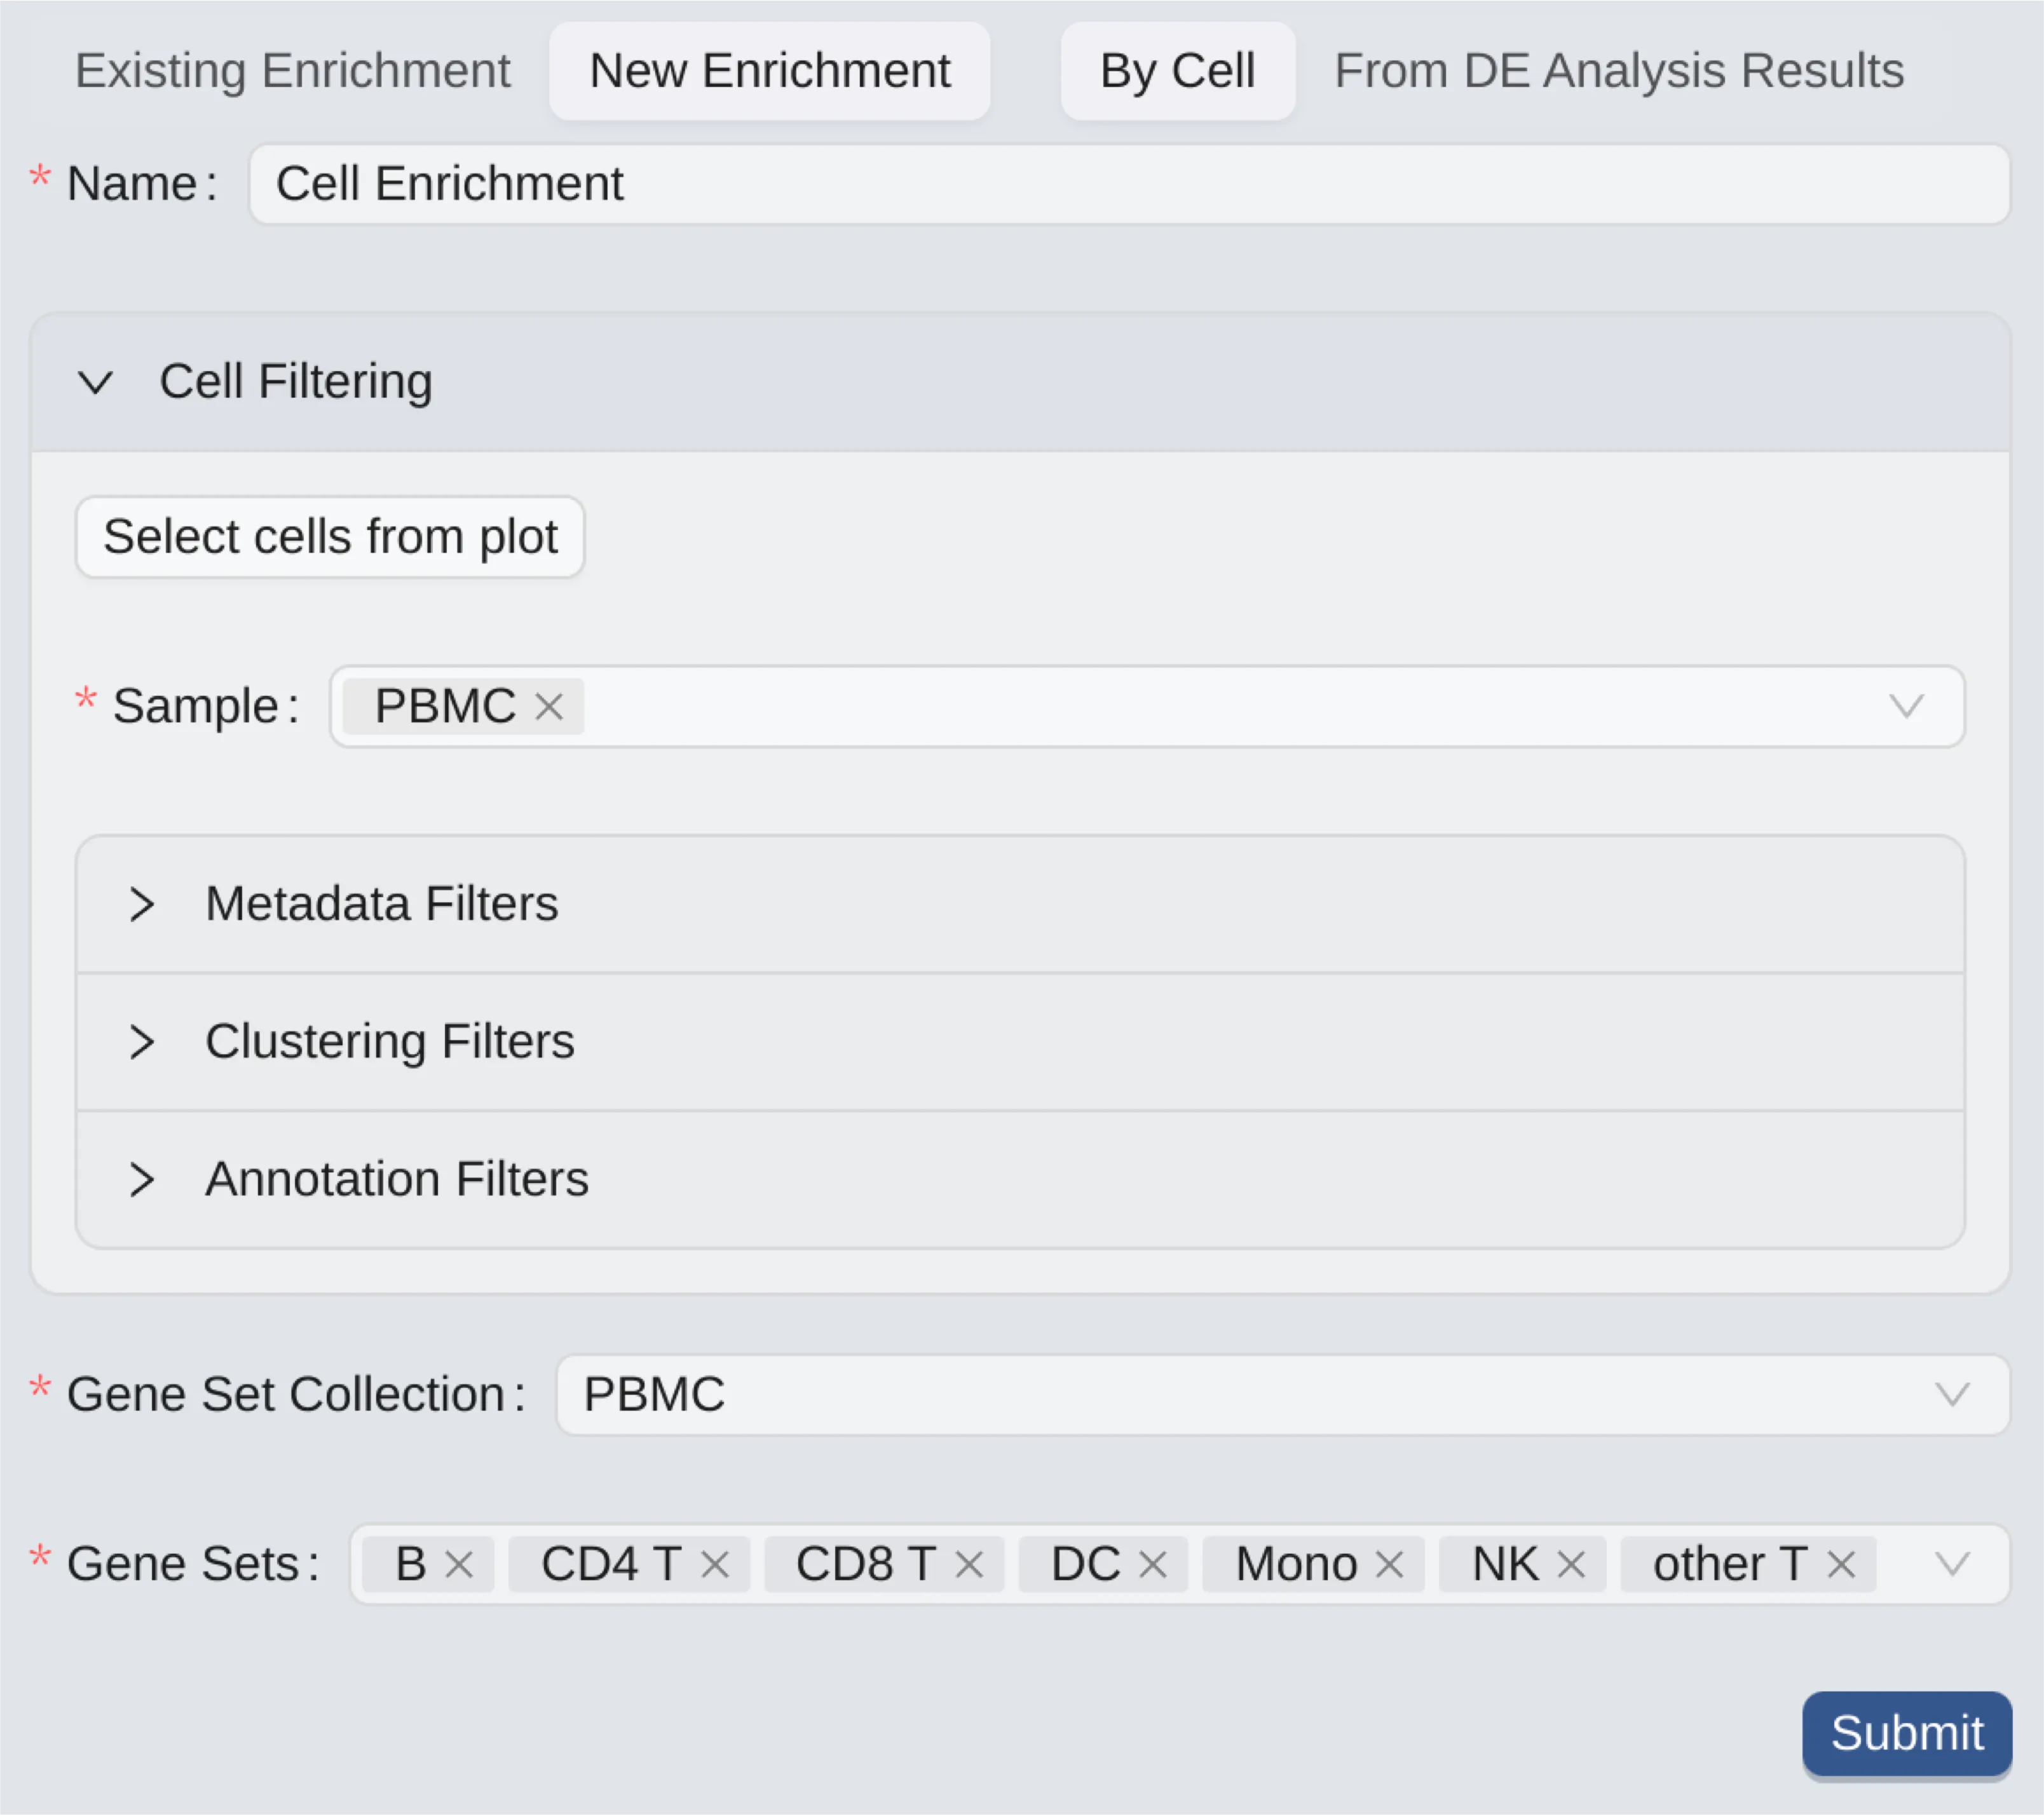
The form to create a new enrichment analysis consists of the following components:
Name: Enter a name for the analysis.
Cell Filtering: Only selected cells will be included in the analysis.
Select cells from plot: Select cells from visualizationsSample: Only cells from selected samples will be included in the analysis.Metadata Filters: Filter cells based on metadata.Clustering Filters: Filter cells based on clusters.Annotation Filters: Filter cells based on annotations.
For more details, see Cell Filtering.
Gene Set Collection: Choose a gene set collection to select its gene sets.
Gene Sets: Only cells that contain genes from the selected gene sets will be included in the analysis.
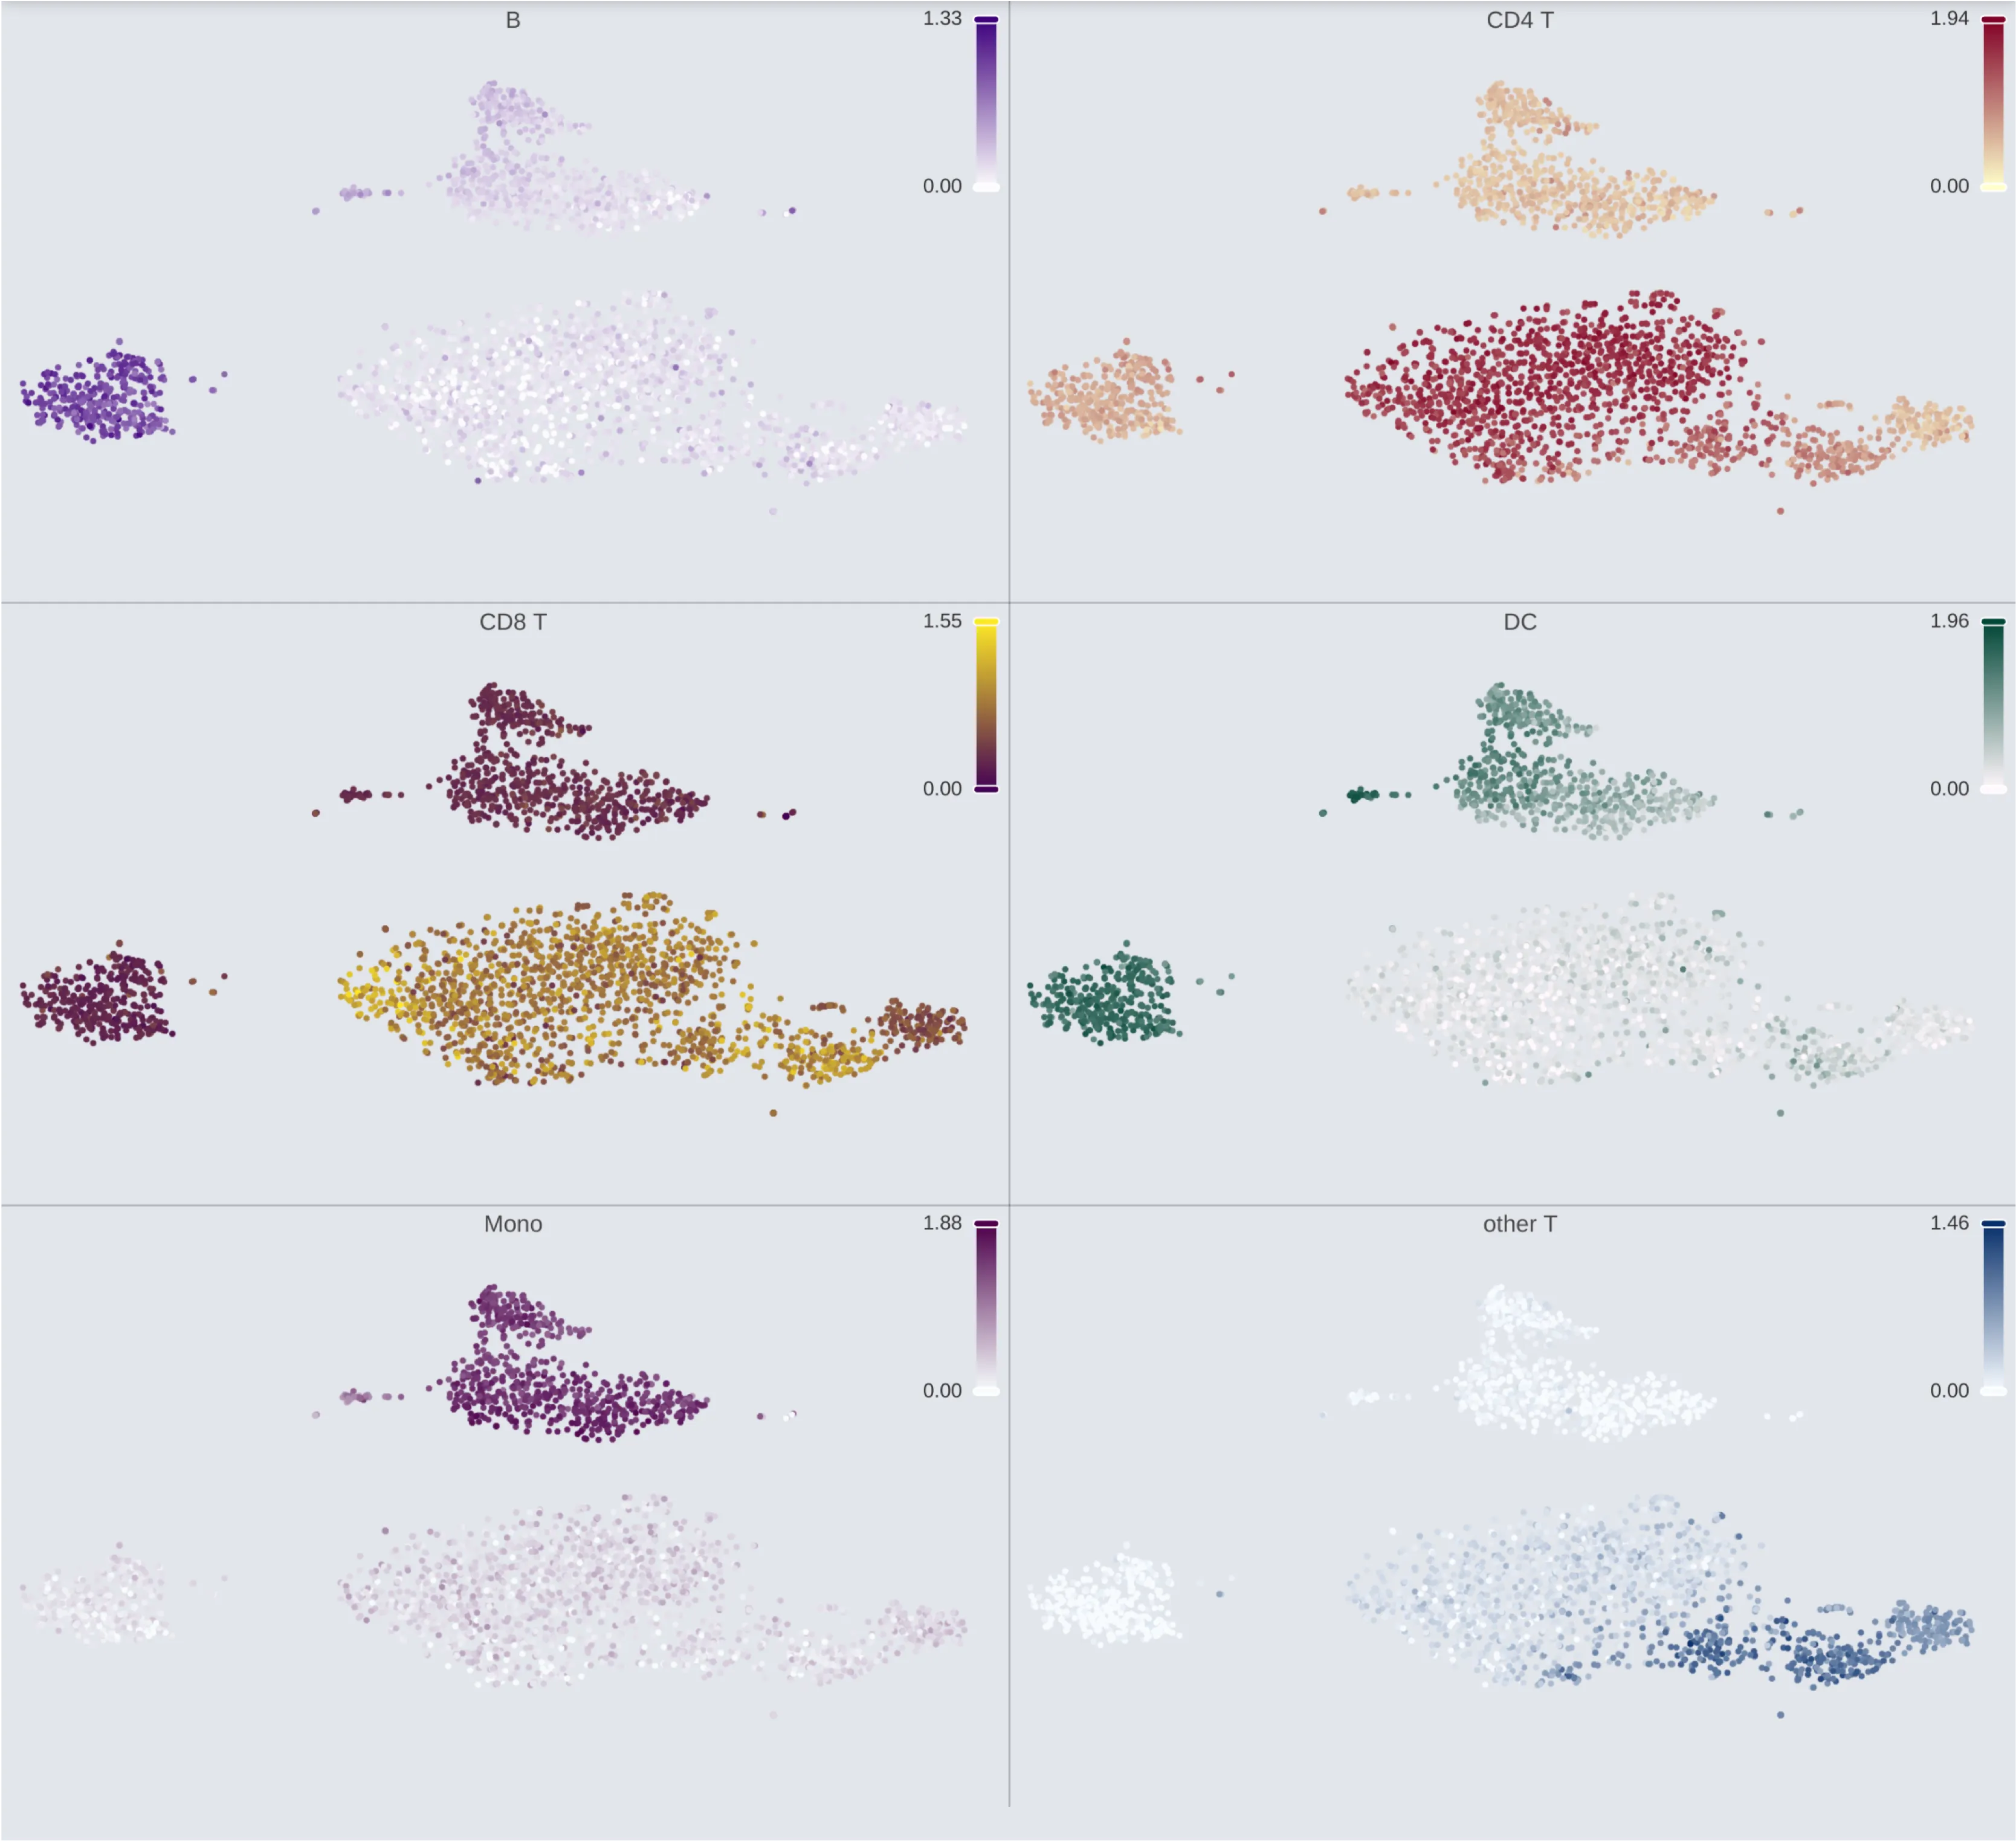
By Cell enrichment analysis is used to perform enrichment analysis on individual cells. It is useful when you want to have an overlook of the difference between gene sets in individual cells, or when you want to see how the genes in a gene set progress across cell landscape. See Visualize Created Enrichment Analyses to see an example of how individual cells are enriched.
By-cell enrichment calculates the enrichment statistics for each cell by comparing the expression of each of the selected gene sets with the remaining genes in the selected gene set collection.
For example, if you selected the following three gene sets:
For each cell, the enrichment analysis will compare:
The expression of
Gene11,Gene12, andGene13withGene21,Gene22,Gene23,Gene31,Gene32, andGene33.The expression of
Gene21,Gene22, andGene23withGene11,Gene12,Gene13,Gene31,Gene32, andGene33.The expression of
Gene31,Gene32, andGene33withGene11,Gene12,Gene13,Gene21,Gene22, andGene23.
From DE Analysis
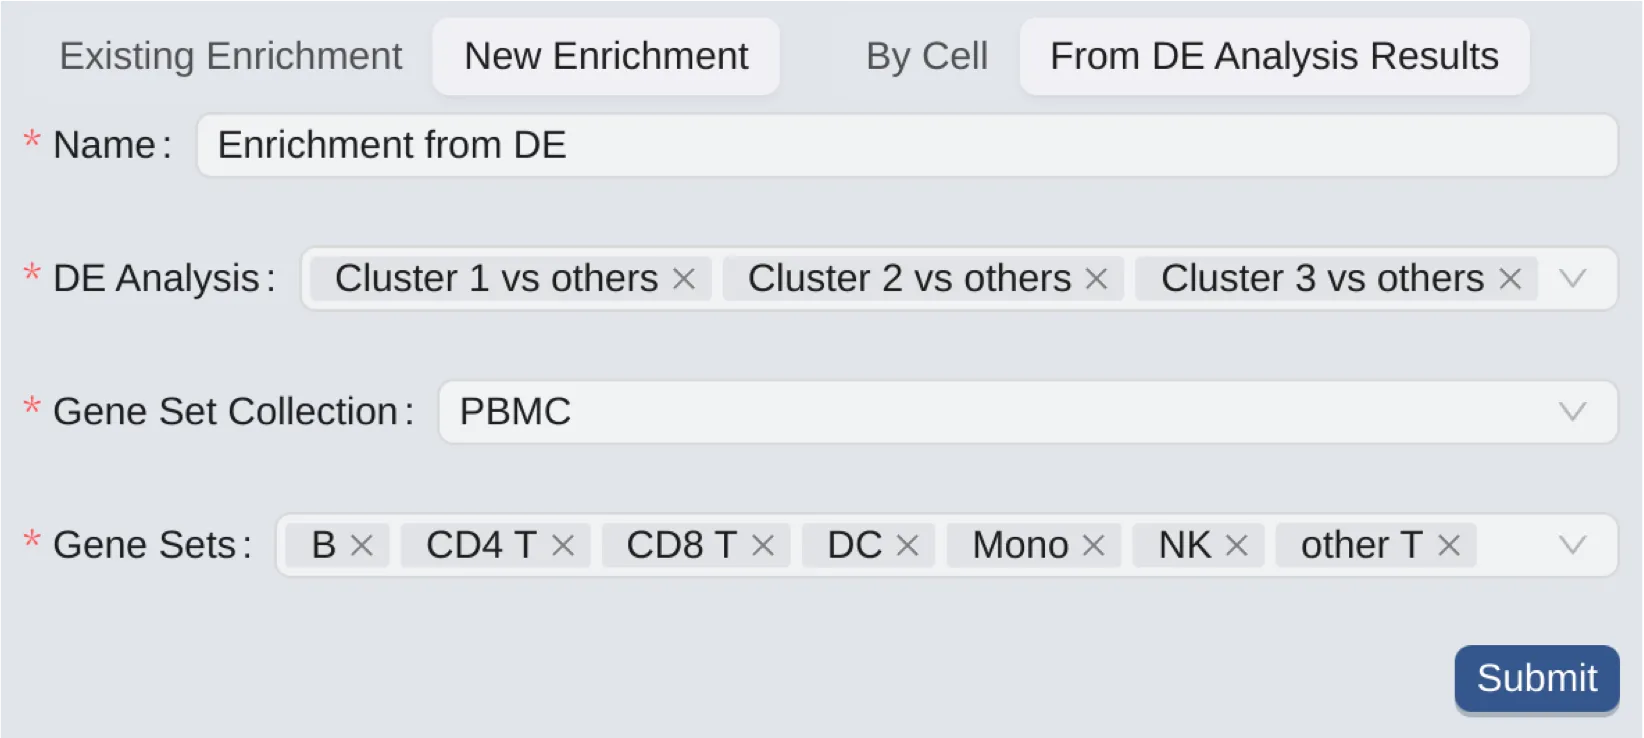
The form to create a new enrichment analysis consists of the following components:
Name: Enter a name for the analysis.
DE Analysis: Choose created DE analyses for the enrichment analysis. See Differential Expression to create DE analyses.
Gene Set Collection: Choose a gene set collection to select its gene sets.
Gene Sets: Only cells that contain genes from the selected gene sets will be included in the analysis.
When performing an enriching analysis from DE analysis, the analysis will use the genes statistics in the DE analysis results to calculate the enrichment statistics for each cell. In other words, its results consider the gene expression differences between the groups of cells that were used in the DE analysis, unlike the by cell enrichment analysis that considers the gene expression differences within individual cells. It is useful when you want to assign biological functions to groups of cells based on the gene expression differences between them.
Using Cell Type Scoring
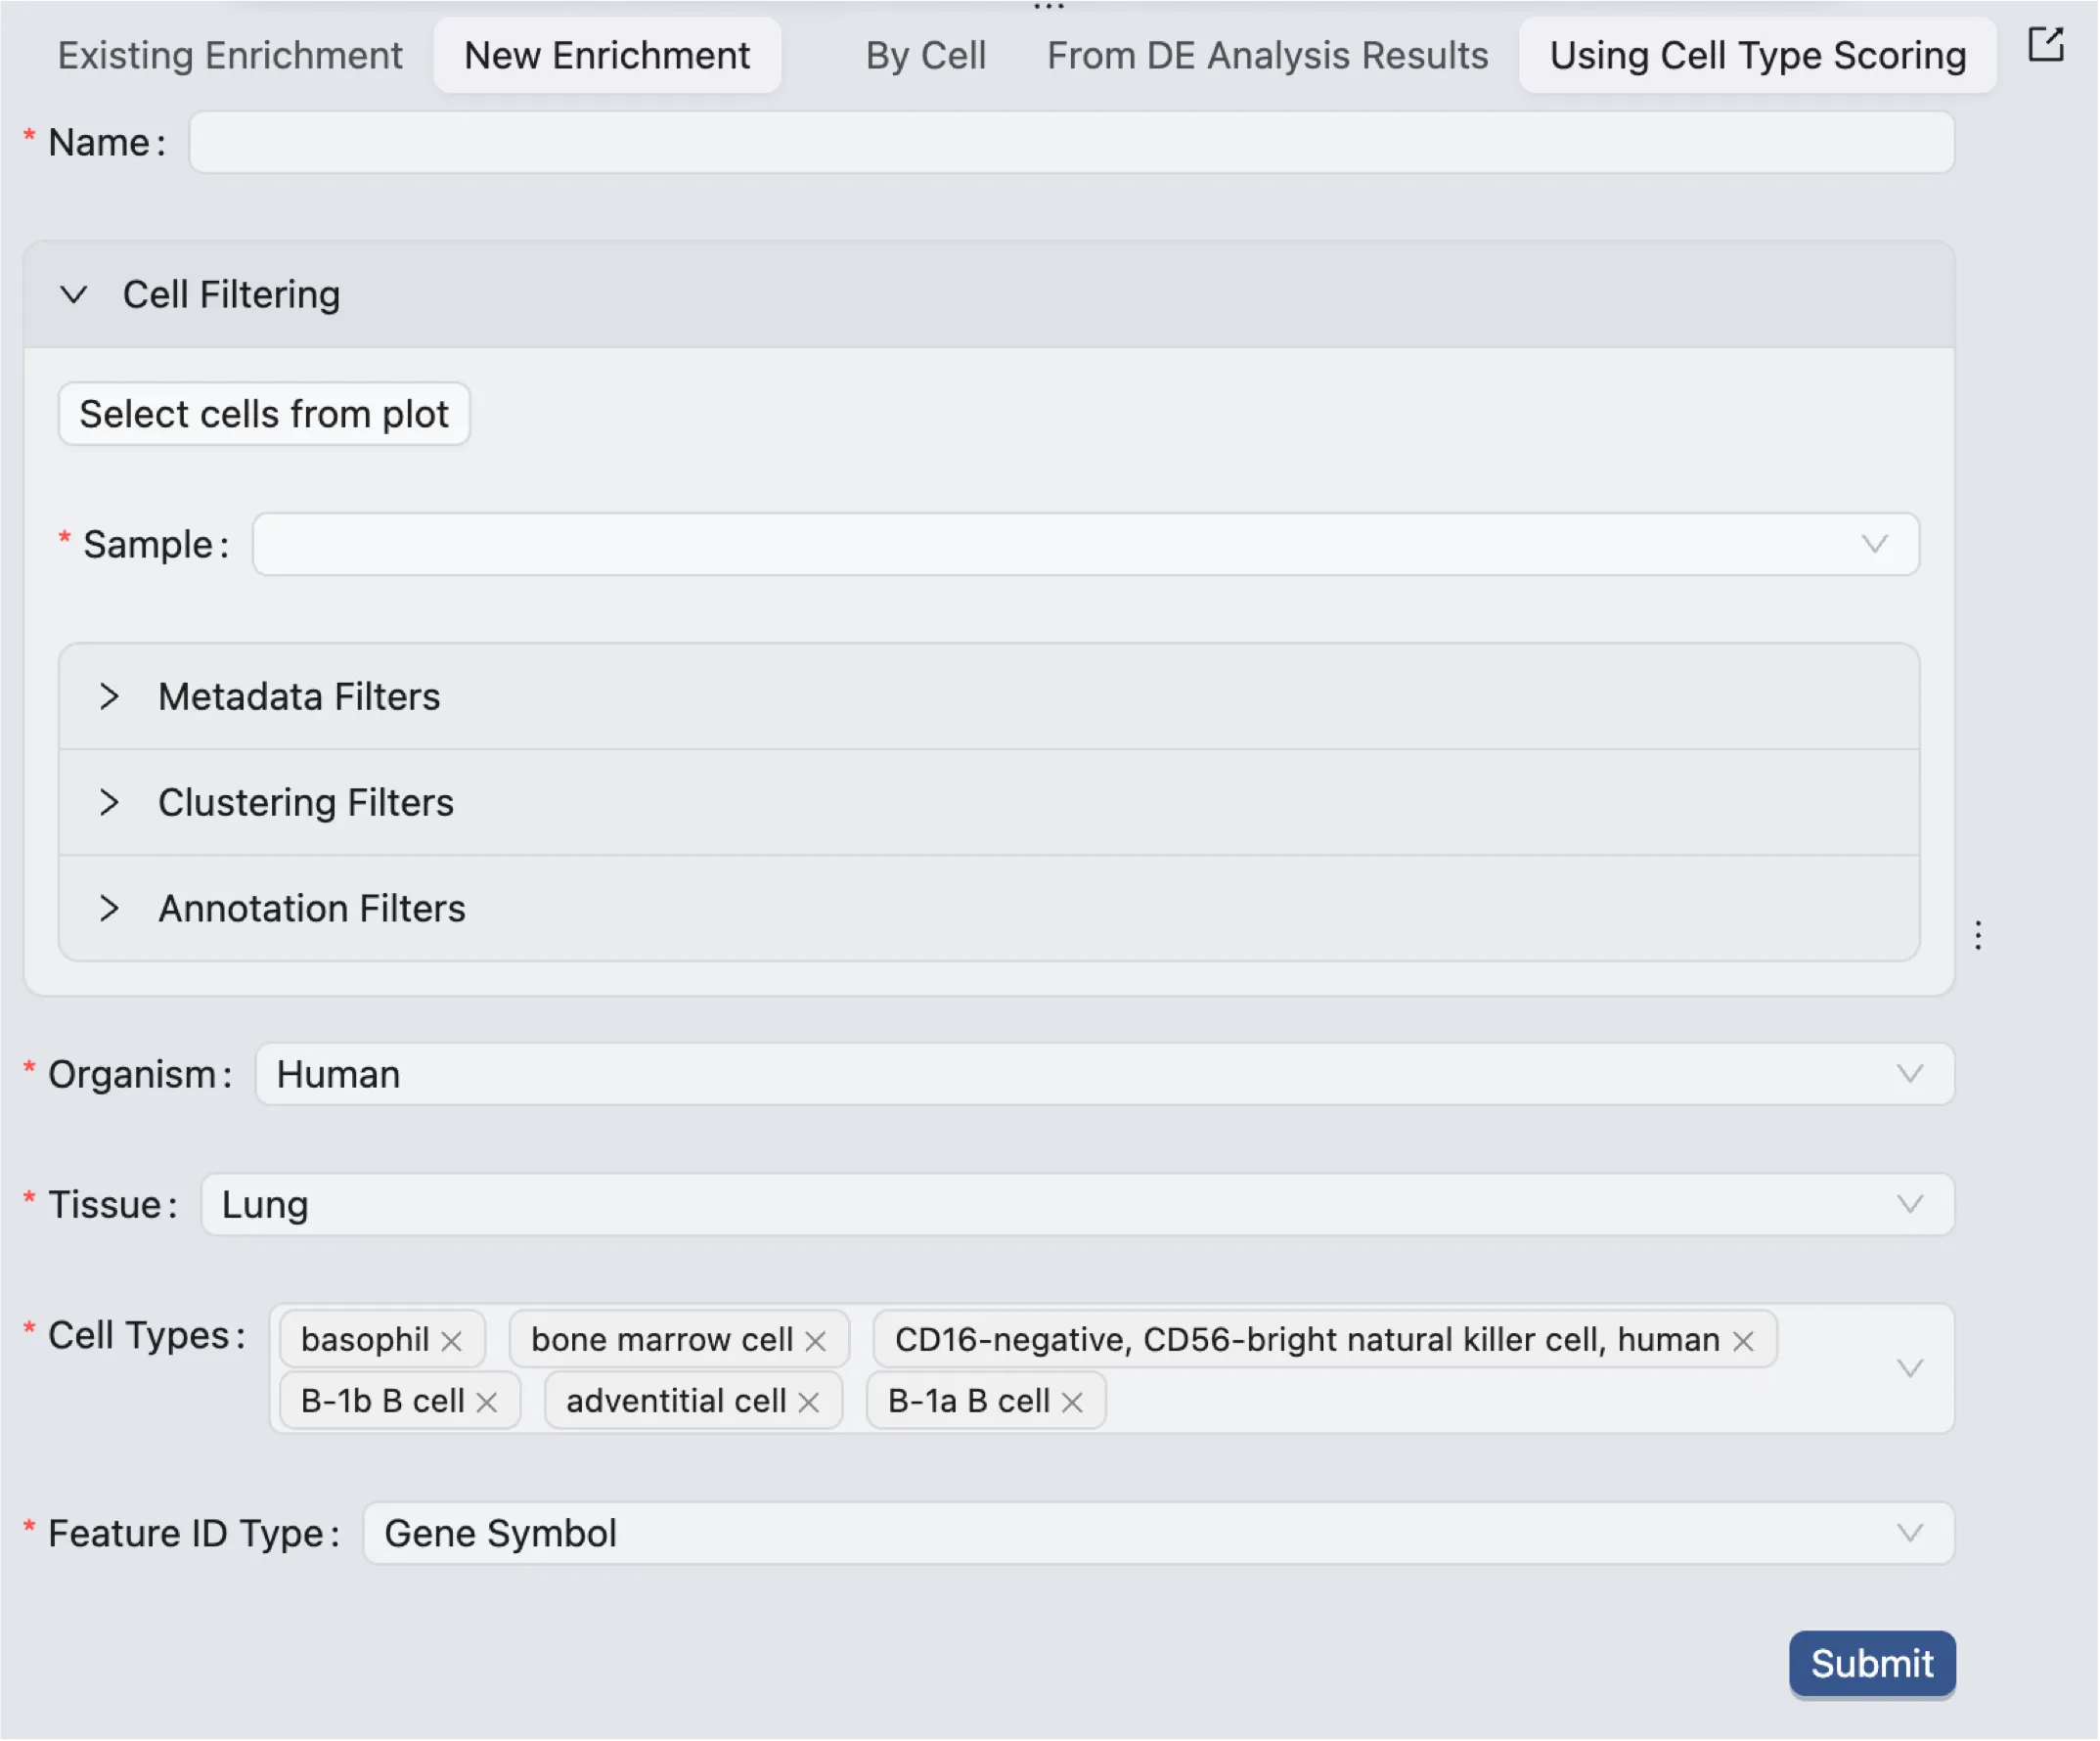
The form to create a new enrichment analysis consists of the following components:
Name: Enter a name for the analysis.
Cell Filtering: Only selected cells will be included in the analysis.
Select cells from plot: Select cells from visualizationsSample: Only cells from selected samples will be included in the analysis.Metadata Filters: Filter cells based on metadata.Clustering Filters: Filter cells based on clusters.Annotation Filters: Filter cells based on annotations.
Organism: Choose the organism for which you want to perform cell type scoring.
Tissue: Choose the tissue for which you want to perform cell type scoring.
Cell Types: Choose the cell types for which you want to perform cell type scoring.
Feature ID Type: Choose the feature ID type of your data.
Cell type scoring computes a score for each cell, and each cell type, based on all the features available in the cell. The score ranges from -1 to 1, where -1 indicates that the expression pattern of the cell is the opposite of the cell type, and 1 indicates that the expression pattern of the cell is the same as the cell type.
Visualize Created Enrichment Analyses
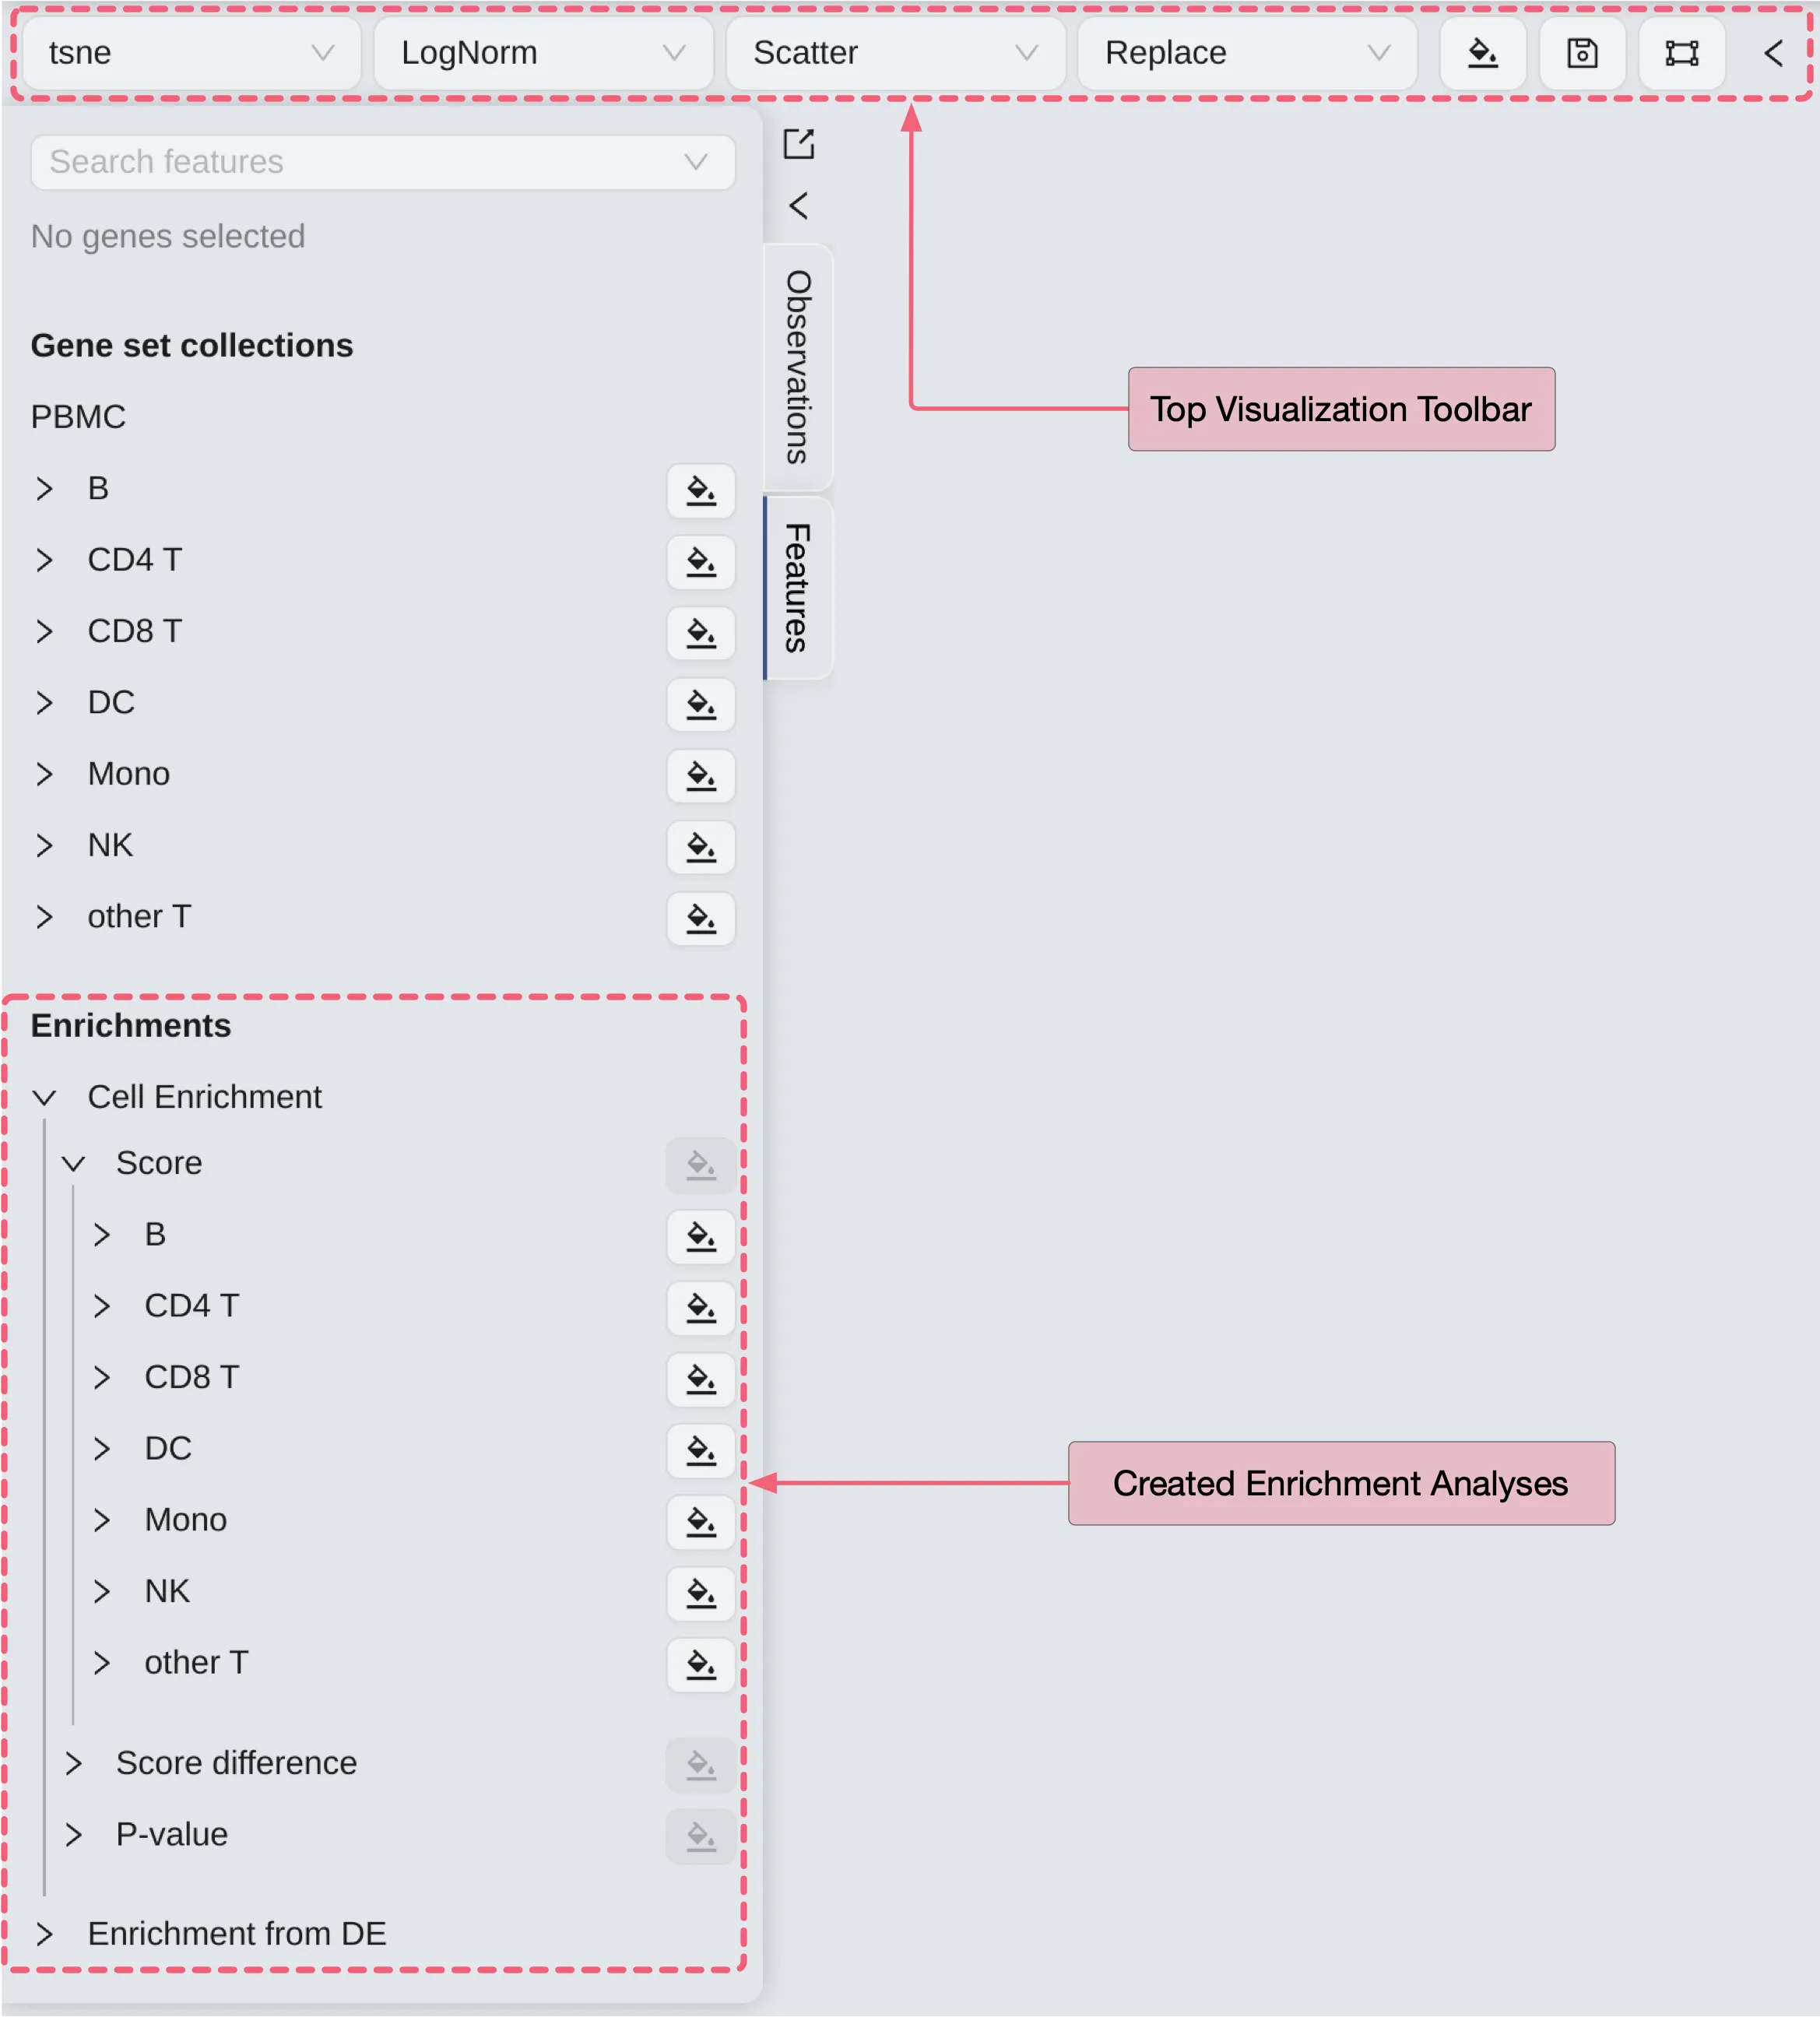
Assuming you have already created two enrichment analyses named Cell Enrichment and Enrichment from DE, follow these steps to visualize them:
In the
Label Selectionpanel on the left side, click theFeaturestab.Under the
Enrichmentslabel, you will see your created enrichment analyses.Click the
Cell Enrichmentlabel to expand the tree. Then click the tree's labels to expand subtrees.Score: The enrichment score of the gene set.
Score difference: The difference in the enrichment score of the gene set with the rest of the genes in the selected gene set collection.
P-value: The p-value of the enrichment score.
Note: Cell Type Scoring will only have the Score label.
Click the
 button to visualize plots.
For example, the following visualization shows the by-cell enrichment score of the gene sets.
Note:
The disabled
 button next to the name of the label indicates that you cannot color the data point in the visualization with the current plot type (in this case, the
 Scatterplot) in theTop Visualization Toolbar.To get more details, hover your mouse over the disabled
 button. A message will be displayed to guide you in choosing the correct type.
For more details about data visualization, see Data Visualization