Cell Annotation
On this page, you will find information about how to annotate cells in CytoAnalyst.
In CytoAnalyst, metadata, which is imported along with samples, is immutable and cannot be edited. We refer to Annotation as the process of adding new metadata to cells in the samples, or the metadata that is created by CytoAnalyst. These annotations can be used as regular metadata and can be freely modified.
Navigation
To access the Cell Annotation panel, click on the Cell Annotation tab on the Data and Analysis Panel.

Workflow
New Annotation
To create a new annotation, click on the New Annotation button. CytoAnalyst supports multiple ways to create a new annotation:
From existing data: Create a new annotation from existing metadata, clusters, or annotations.
From enrichment analysis: Create a new annotation from enrichment analysis results.
Using cell type prediction: Create a new annotation using cell type prediction.
From Existing Data
To create a new annotation from existing data, click on Use Existing Data.
New Annotation Form
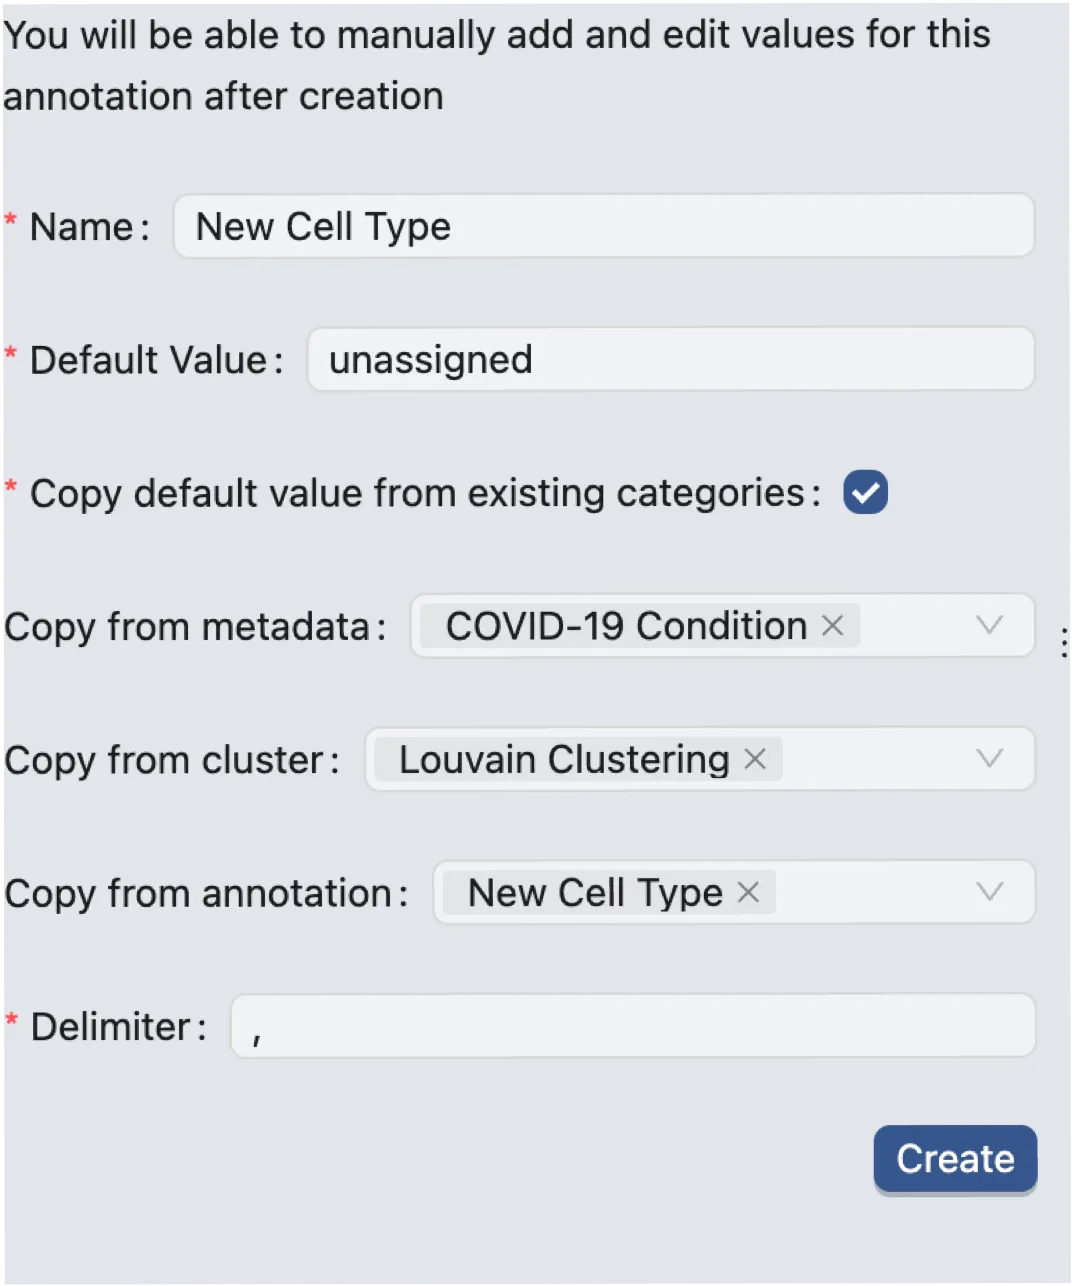
The annotation form allows you to create a new annotation by copying the default value from existing metadata, clusters, or annotations. This is useful when you want to create a new annotation based on existing data or want to combine multiple annotations into a single annotation.
The new annotation form consists of the following fields:
Name: Enter a name for the new annotation.
Default Value: Enter a default value for the new annotation. This value will be assigned to all cells by default or when there is missing data.
Copy Default Value From Existing Categories: Select this box if you want to copy the default value from other metadata, clusters, or annotations.
Copy From Metadata: Select one or more metadata fields from which you want to copy.
Copy From Cluster: Select one or more clusters from which you want to copy.
Copy From Annotation: Select one or more annotations from which you want to copy.
Delimiter: Use this field to specify the delimiter for the copied values if you are copying from multiple fields.
Preview
A preview of the new annotation is displayed beside the form and is updated in real-time as you modify the form.
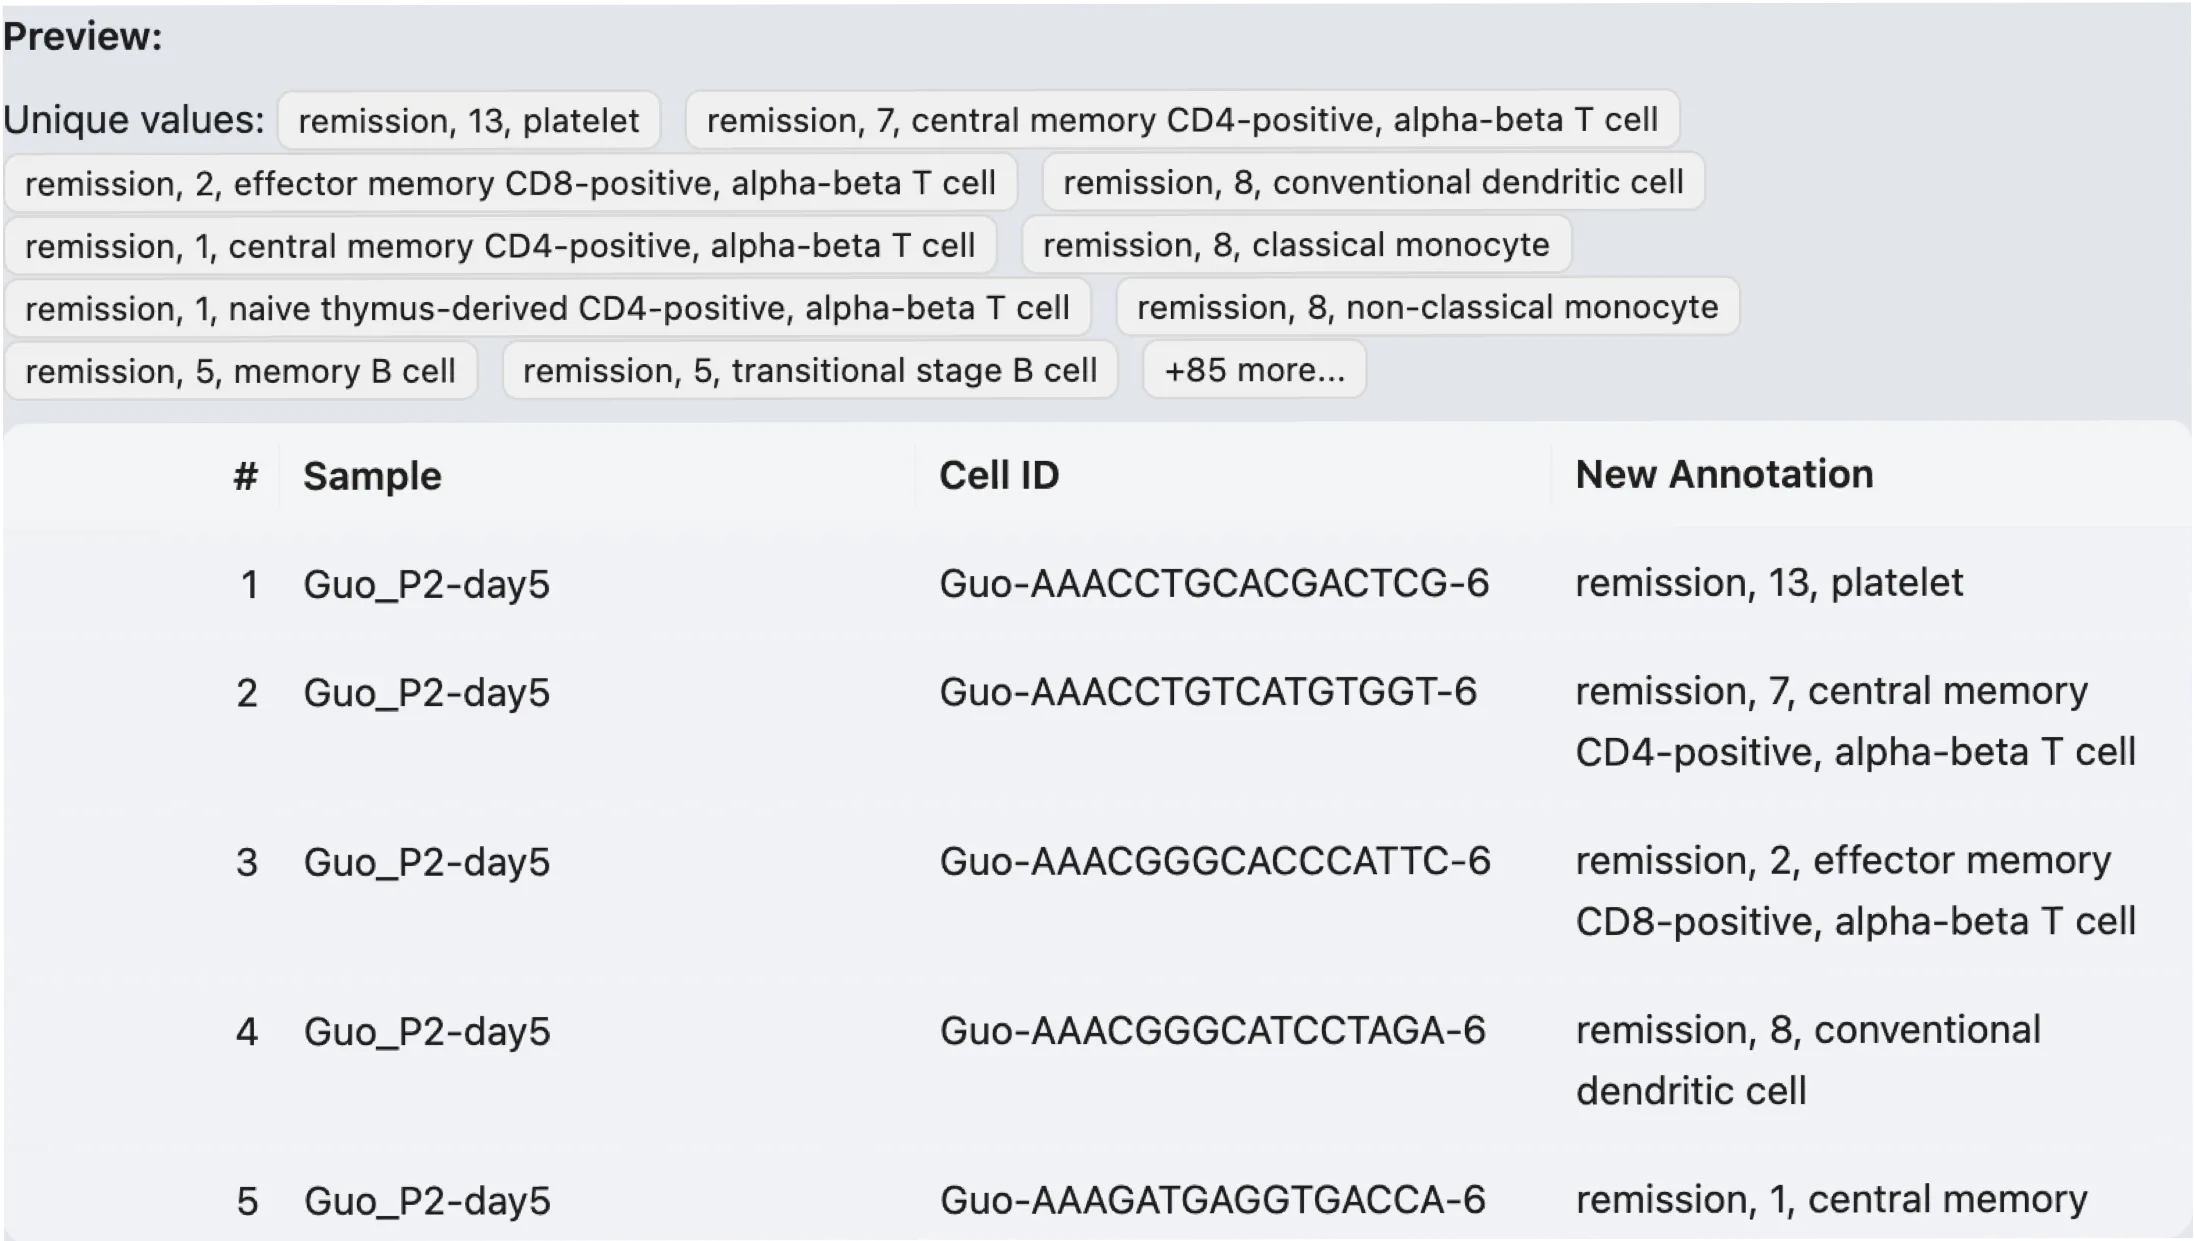
The preview table consists of the following columns:
#: The index of the cell.
Sample: The sample that the cell belongs to.
Cell ID: The unique identifier of the cell within the sample.
Annotation: The value of the new annotation for the cell. The title of this column is the name of the new annotation.
Click on the Create button to create the new annotation. You can view the new annotation in the Existing Annotations section or edit the annotation by going to the Edit Annotation section.
From Enrichment Analysis
You must have performed enrichment analysis to create a new annotation from enrichment analysis results. To see how to perform enrichment analysis, see Enrichment Analysis.
To create a new annotation from enrichment analysis results, click on From Enrichment. The interface of creating a new annotation from enrichment analysis results is as follows:
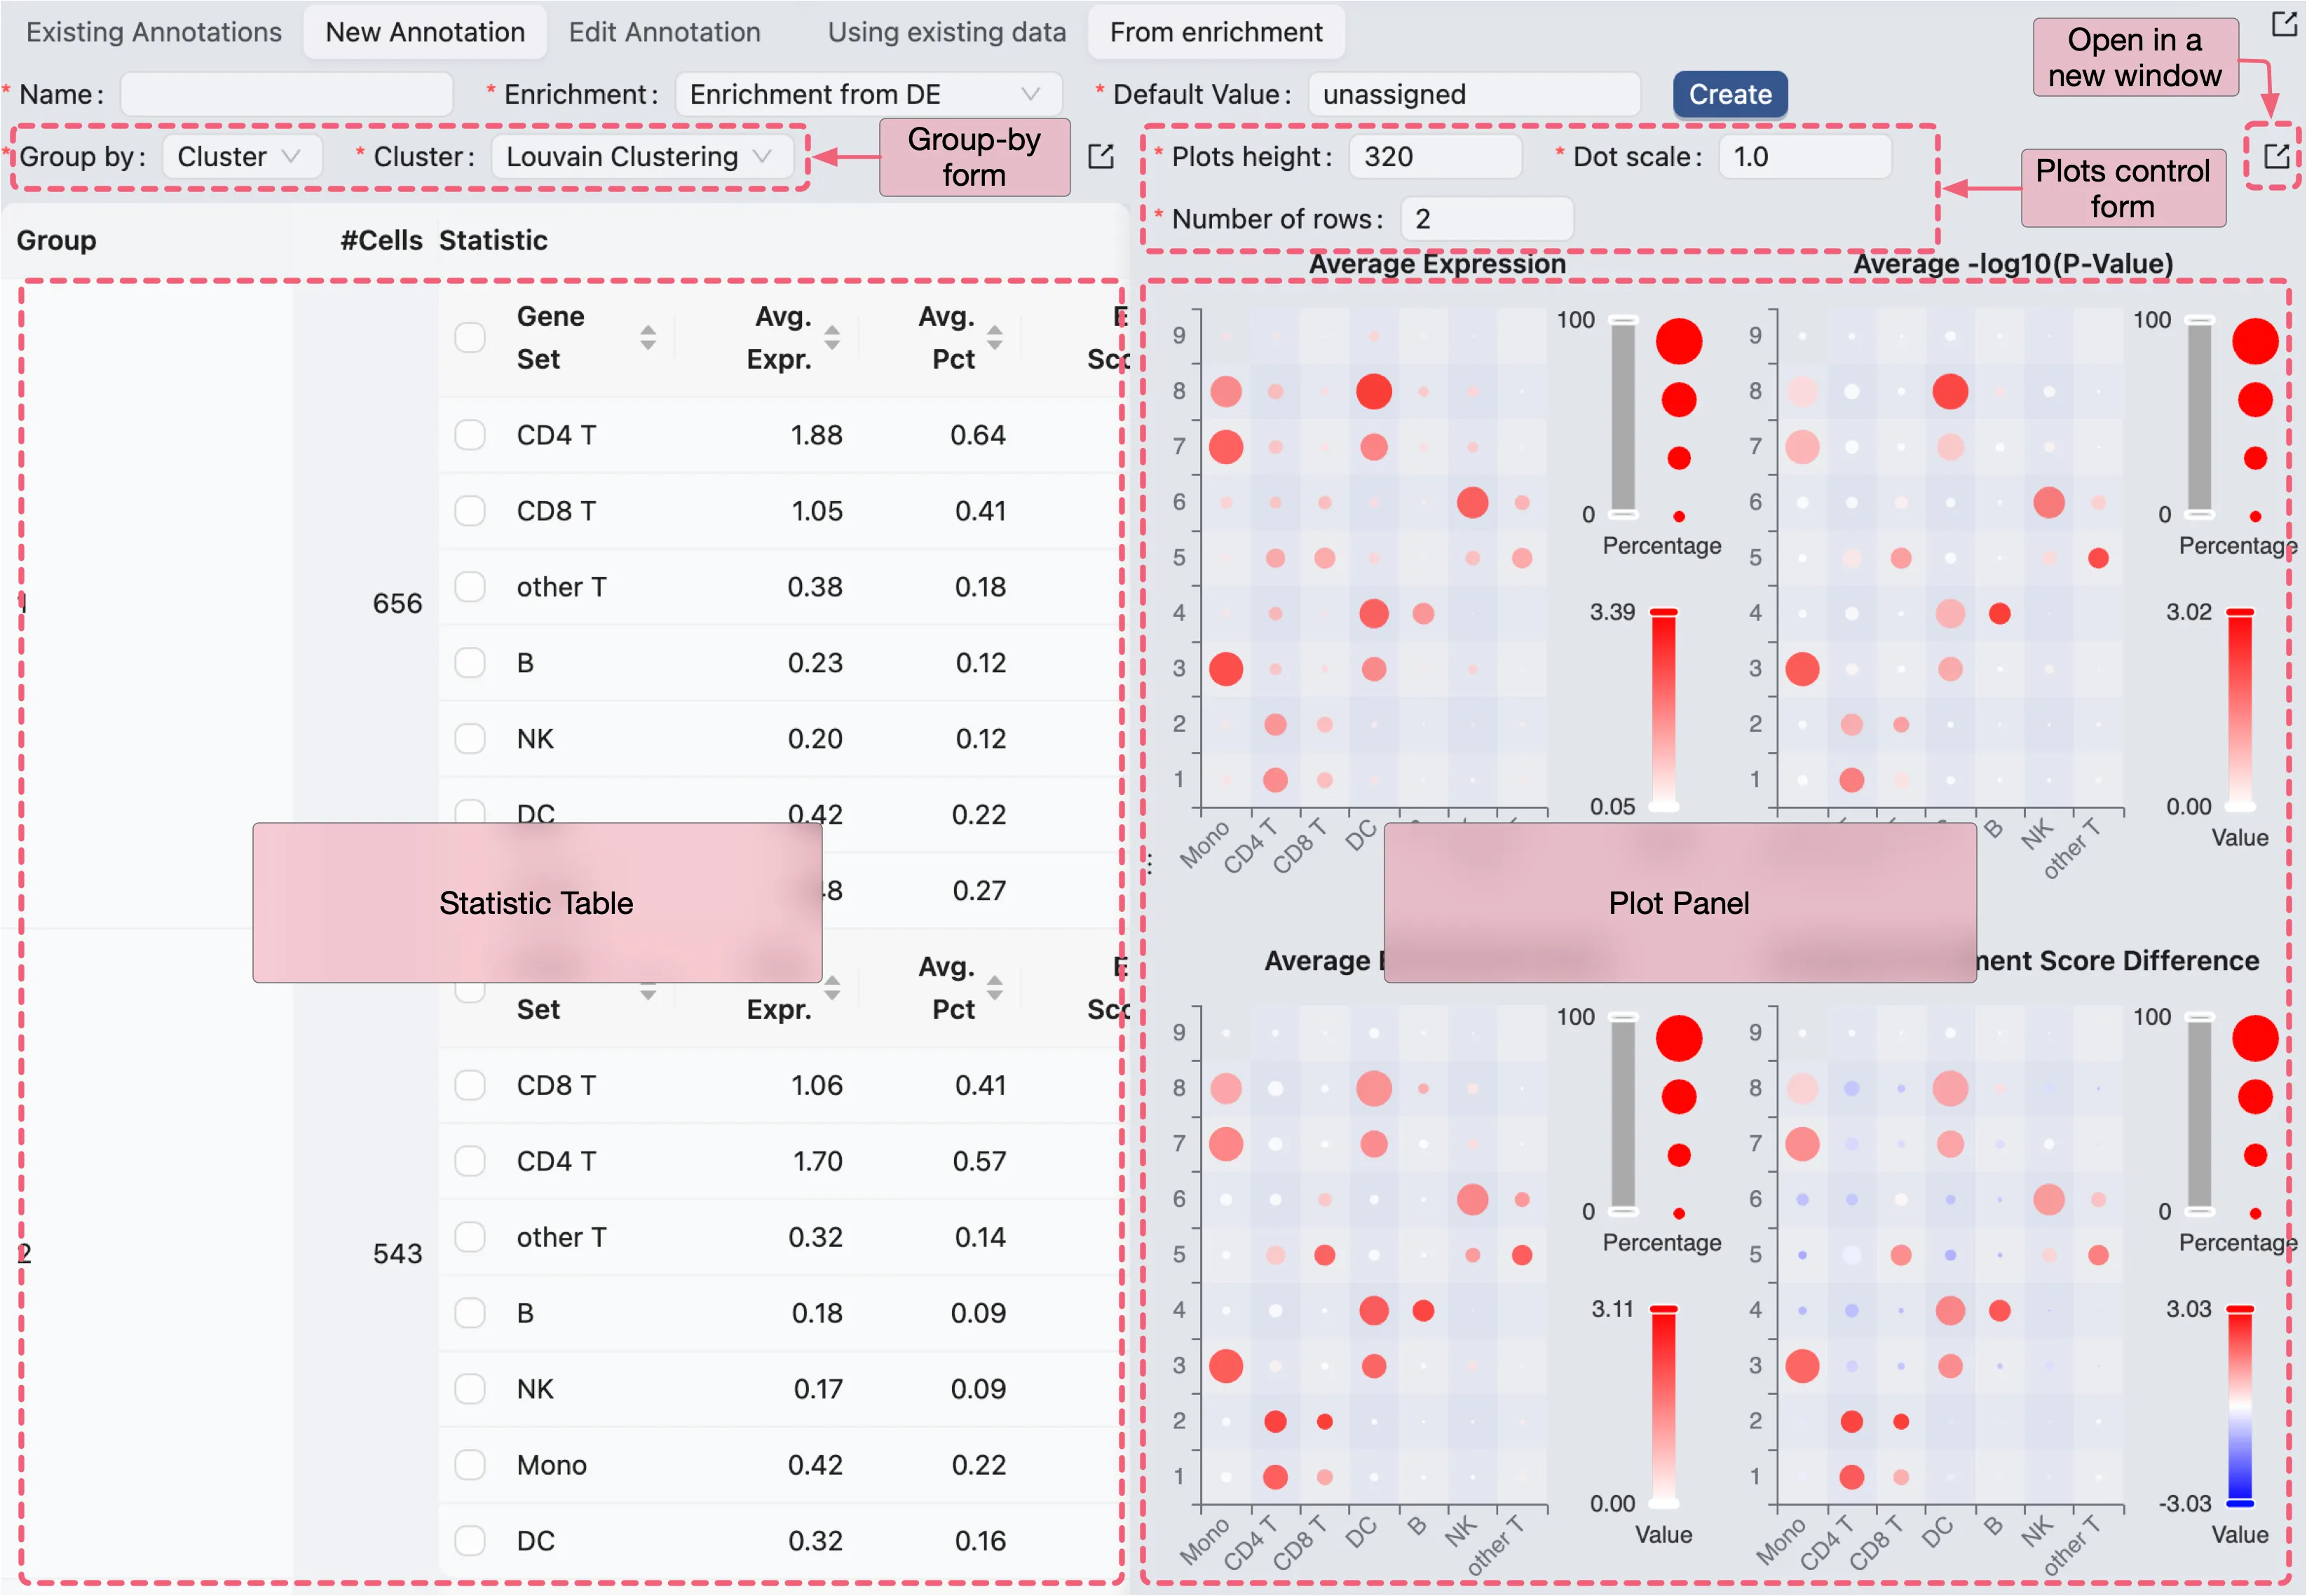
There are two main sections in the interface:
Statistics: This section displays the statistics of the enrichment analysis results.
Plots: This section displays the plots of the enrichment analysis results.
Each of the sections can be opened separately in a new window by clicking on the ![]() icon.
icon.
Statistics
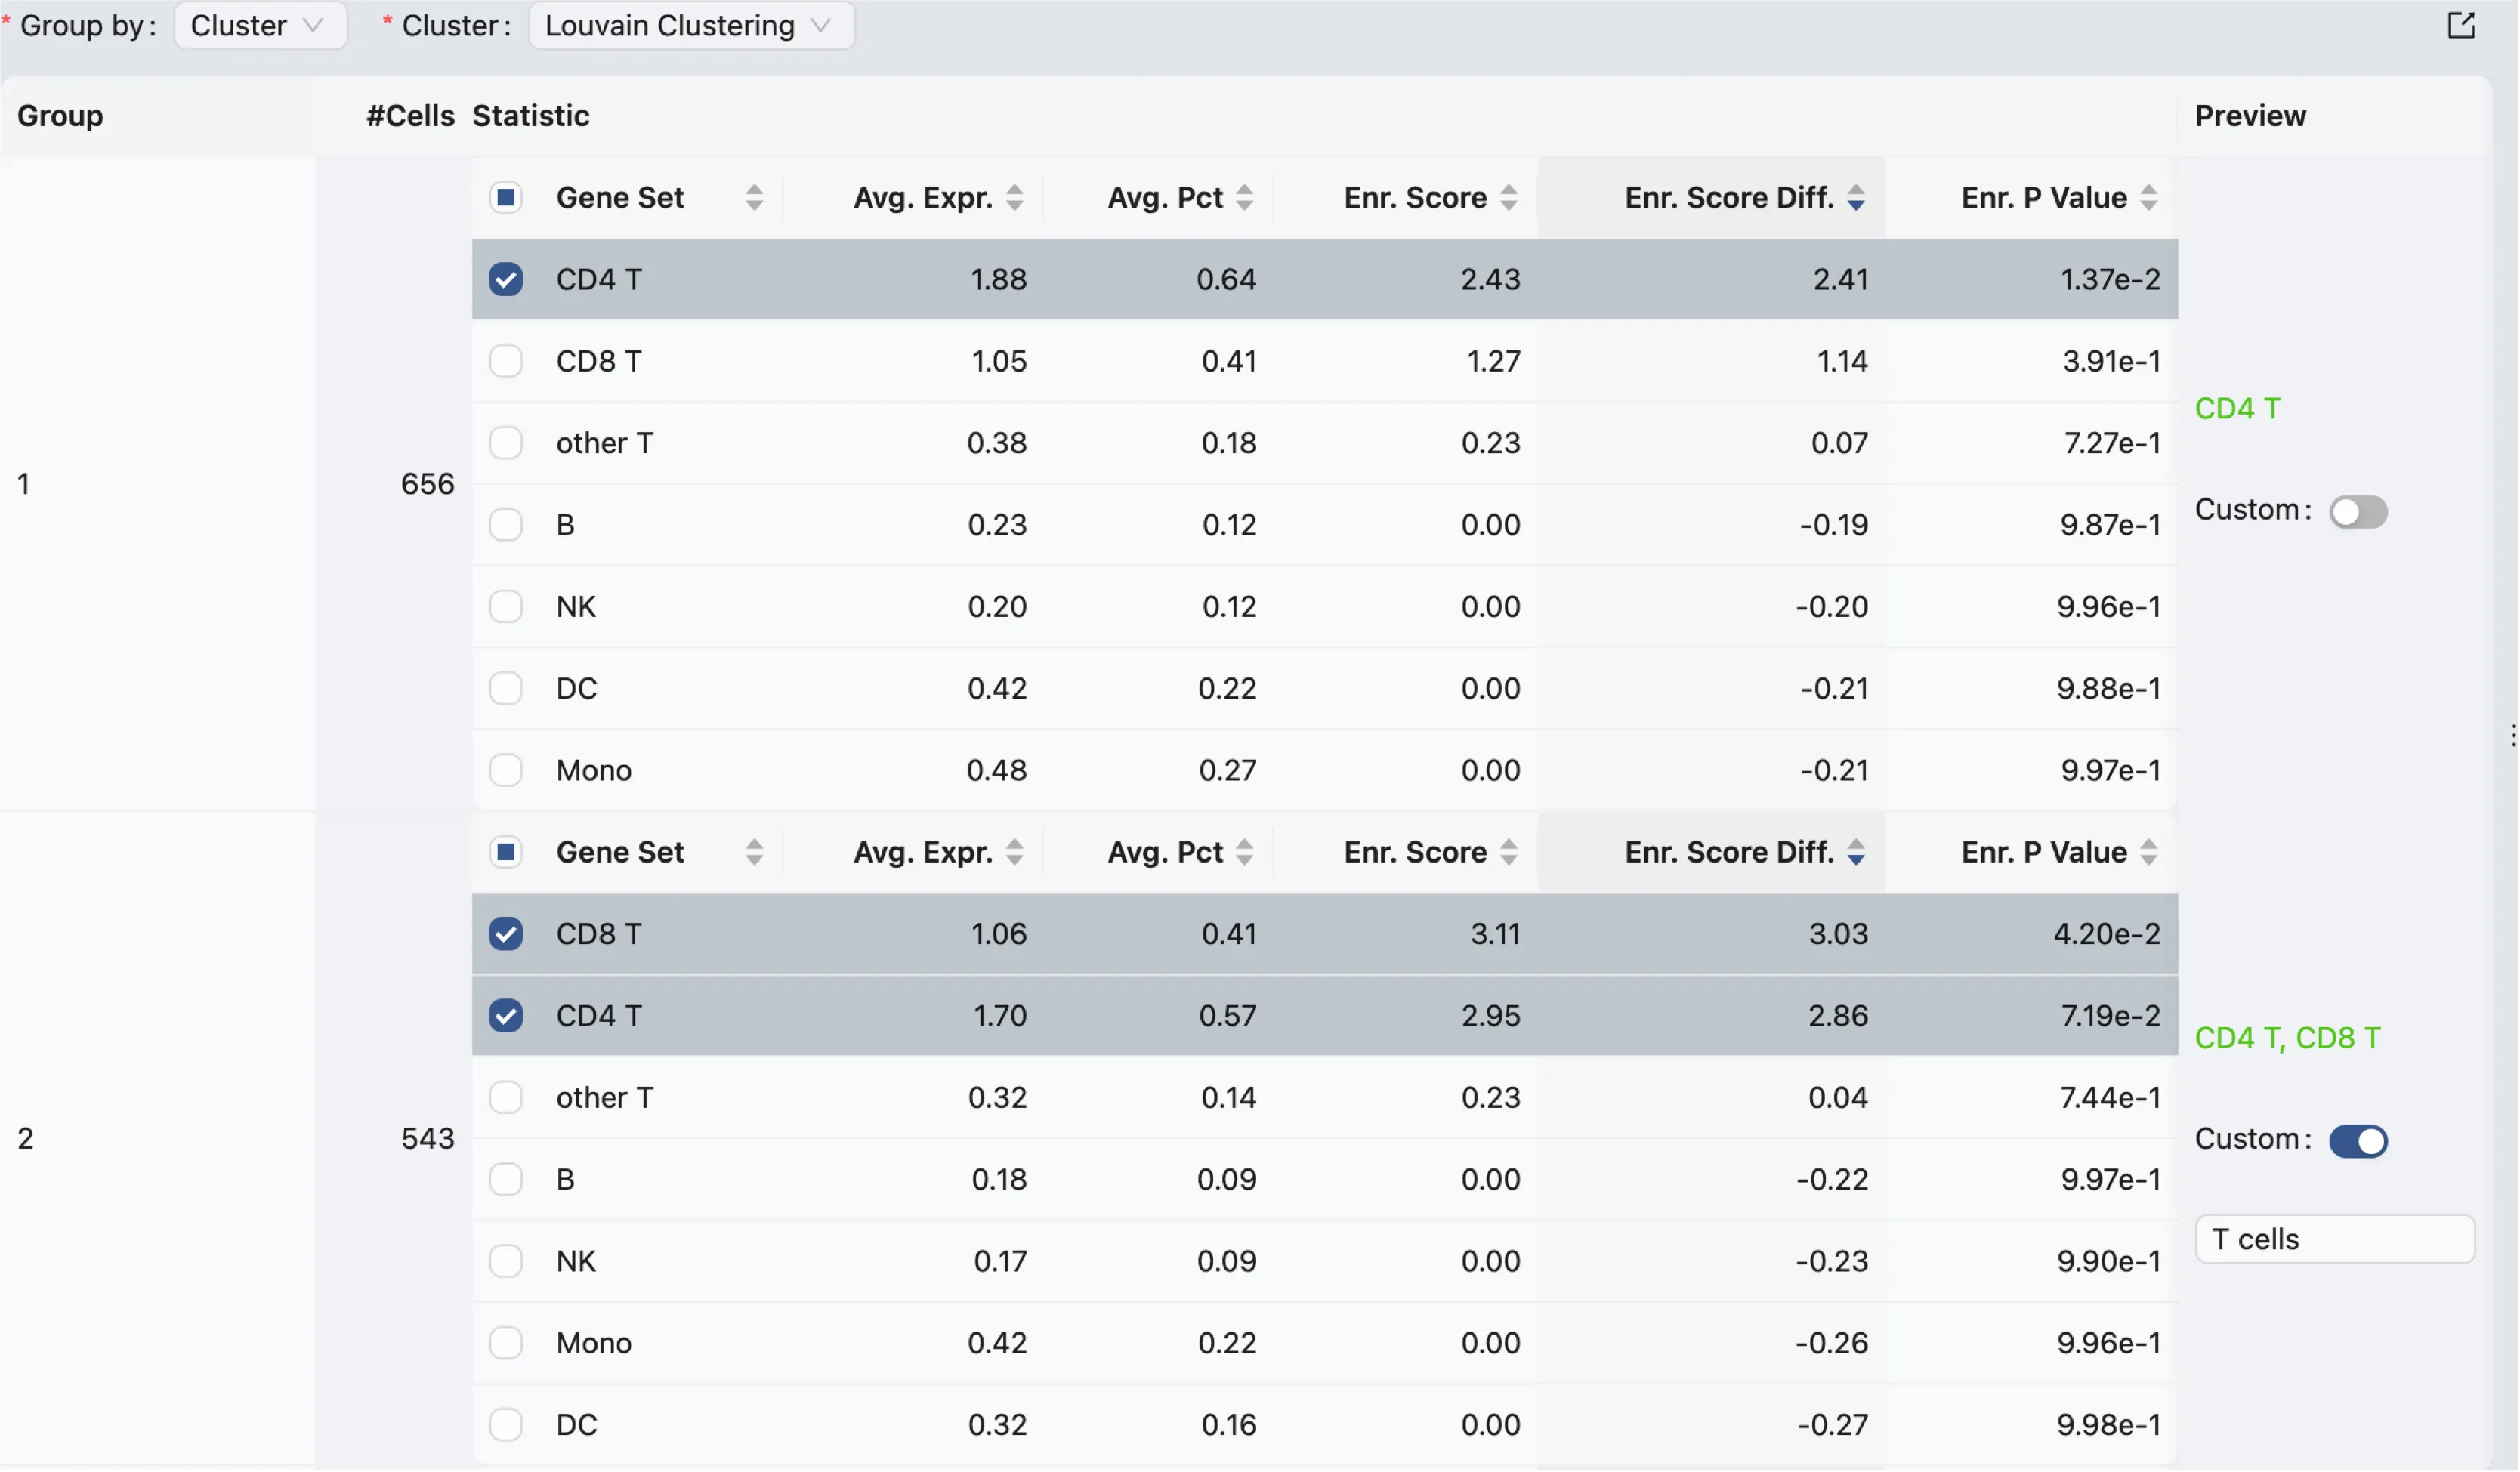
The statistics section allows you to group cells based on existing clusters, metadata, or annotations. It then calculates the enrichment of gene sets in each group of cells and displays the results in a table.
The table consists of the following columns:
Group: The name of the group.
# Cells: The number of cells in the group.
Genes Set: The name of the gene set.
Average Expression: The average expression of genes in the gene set.
Average Percentage: The average percentage of cells in the group that express the genes in the gene set.
Enrichment Score: The enrichment score of the gene set in the group.
Enrichment Score Difference: The difference in enrichment score between the group and the rest of the cells.
Enrichment P-Value: The p-value of the enrichment score.
Preview: A preview of the new label that will be assigned to the group when the annotation is created.
There are two ways to assign a new label to the group:
Using Checkbox: Select the checkbox next to the gene set names to indicate that you want to use the gene set name as the new label.
You can select multiple gene sets to combine them into a single label.
Using Custom Label:
Enable custom label by clicking on the
Customswitch in the preview column.Enter a custom label in the text field that appears.
Plots
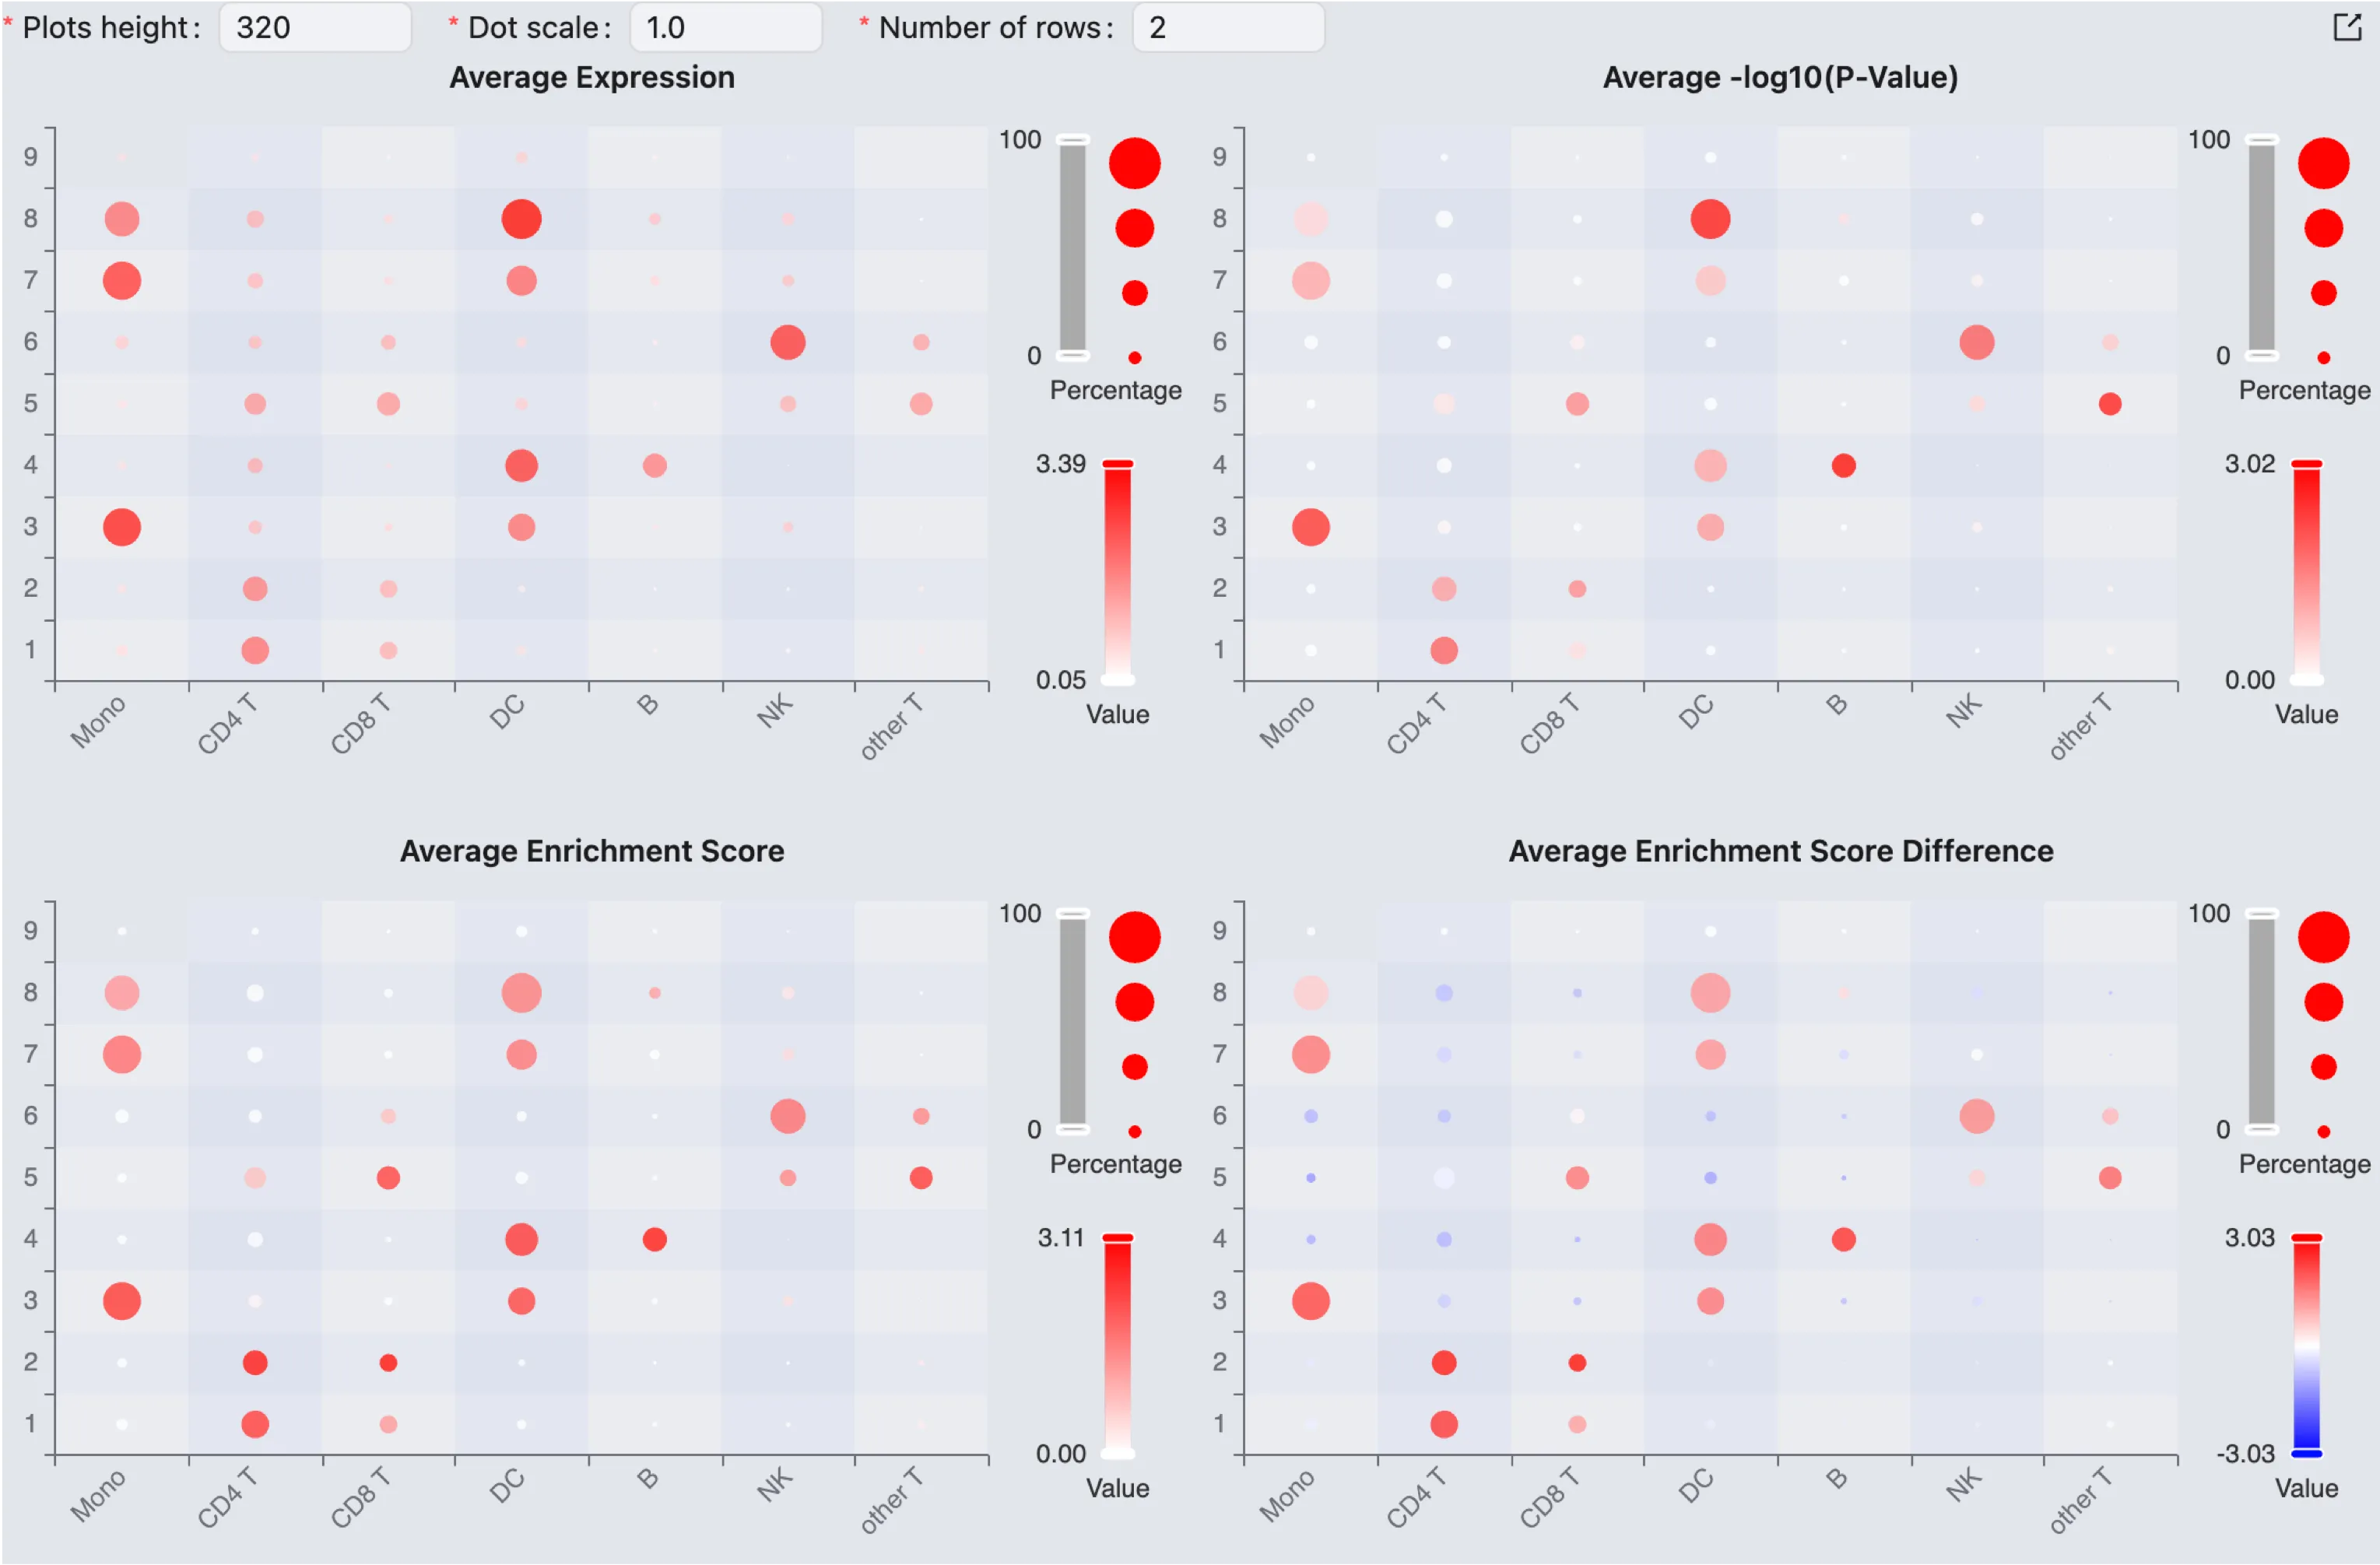
The plots section displays four dot plots for:
Average Expression: The average expression of genes in the gene set.
Average -log10(P-Value): The average -log10(p-value) of the gene set.
Average Enrichment Score: The average enrichment score of the gene set.
Average Enrichment Score Difference: The average difference in enrichment score between the group and the rest of the cells.
In each plot:
x-axis: The gene sets.
y-axis: The groups of cells.
The size of the dots represents the percentage of cells expressing the gene set in the group.
The color of the dots represents the value of the selected metric.
Using Cell Type Prediction
Existing Annotations
The existing annotations table displays all the annotations that have been created in CytoAnalyst.

Here you can change the name of the annotation by expanding the annotation row and editing the name field.
Edit Annotation
To edit existing annotations, click on the Edit Annotation button to open the edit interface.
Annotation Table
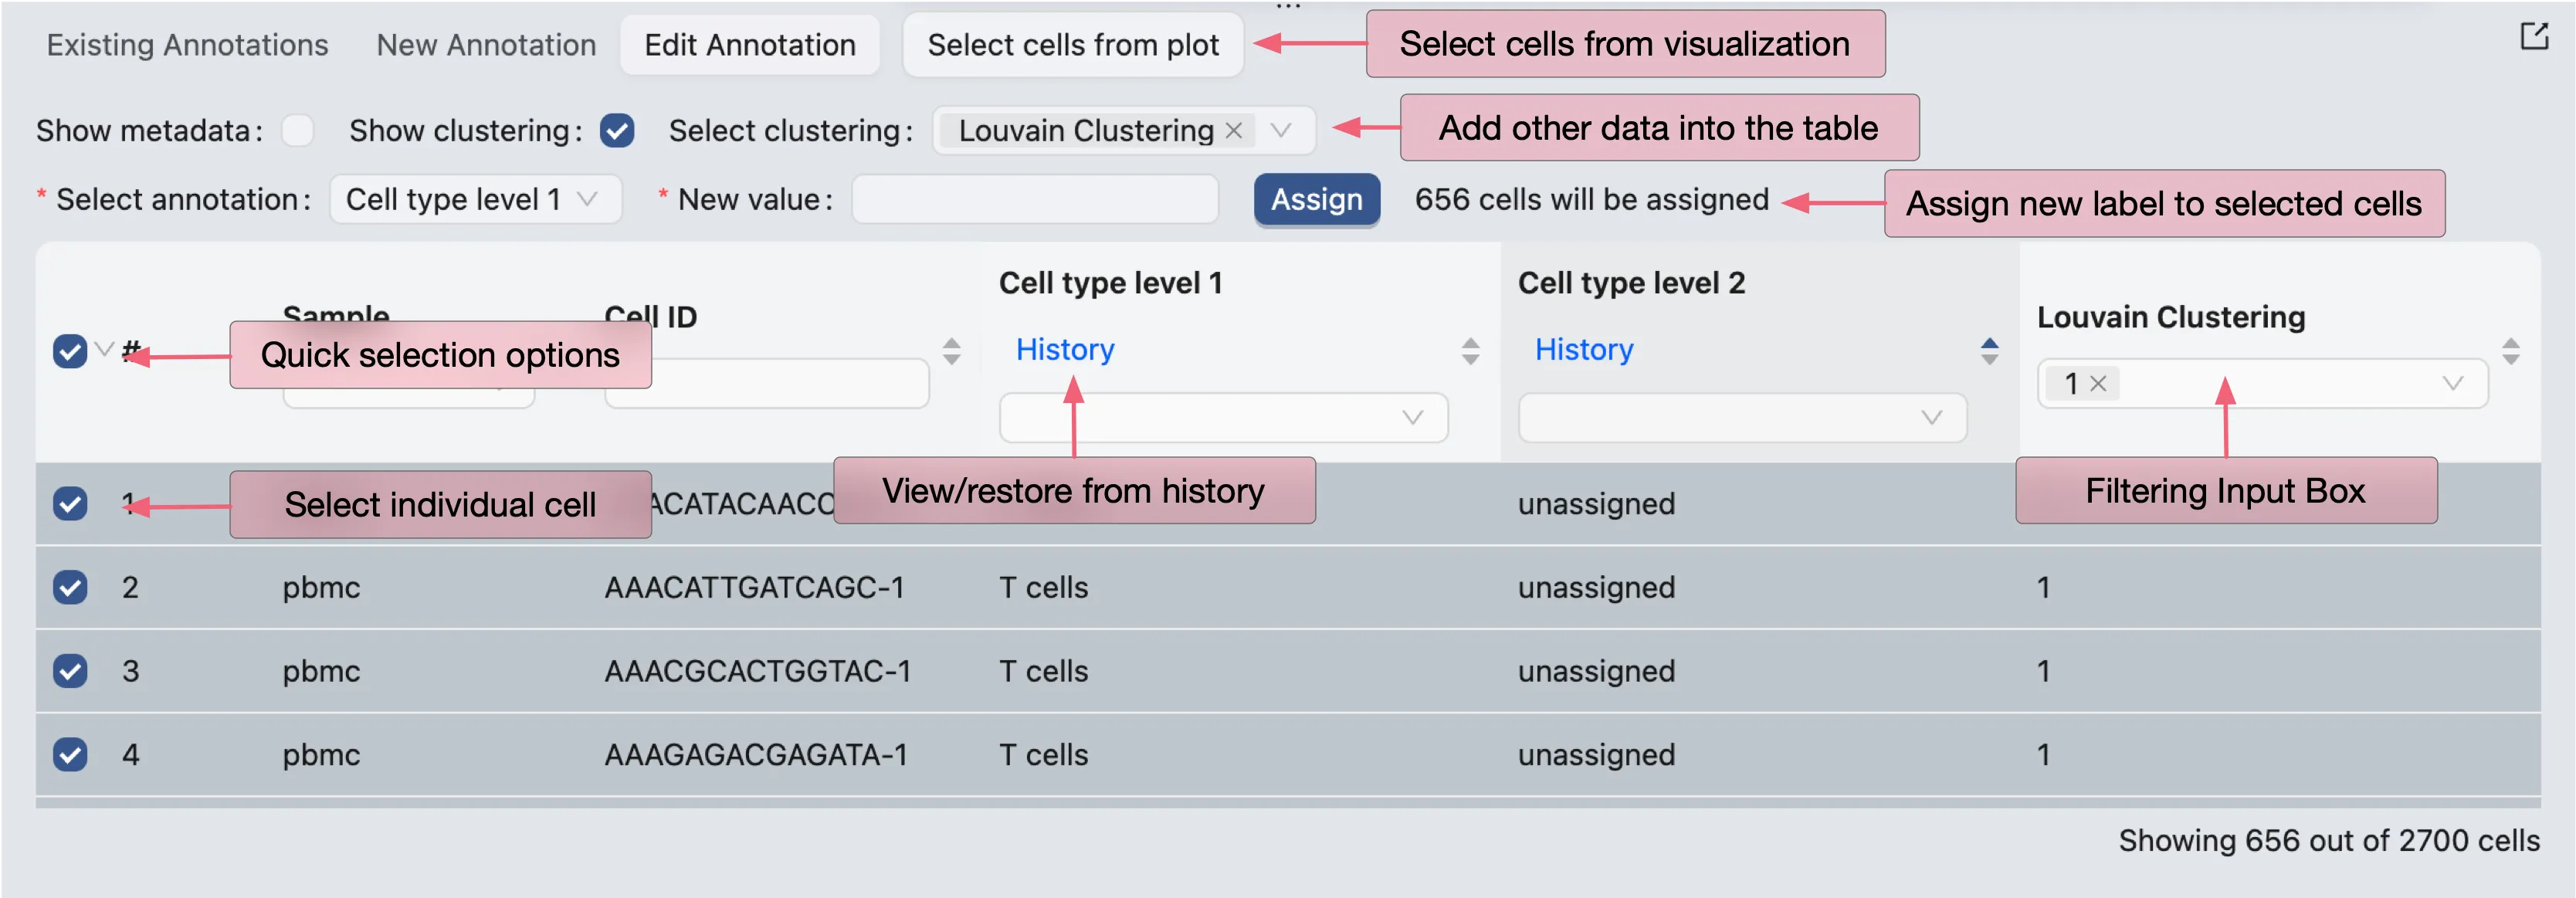
The main component of the edit interface is the annotation table, it displays the following columns:
#: The index of the cell.
Sample: The sample that the cell belongs to.
Cell ID: The unique identifier of the cell within the sample.
Annotation 1: The value for Annotation 1. Here Annotation 1 is the name of the annotation.
Annotation 2: The value for Annotation 2. Here Annotation 2 is the name of the annotation.
...: The value for other annotations.
You can add other data, including metadata, and clusters to the table by selecting Show Metadata and Show Clusters respectively, then selecting the metadata fields and clusters you want to display.
Assign New Value
To assign a new value to a cell or a group of cells, check the checkboxes in the first column of the cell rows. A new form will appear at the top of the table where you can select the annotation you want to edit and assign a new value to it.
Filter Cells
You can filter cells based on any column in the table or select cells from visualizations. Visit Cell Filtering for more information on how to filter cells from visualizations.
History
The history of the annotation is displayed when you hover over the History button under the annotation name.
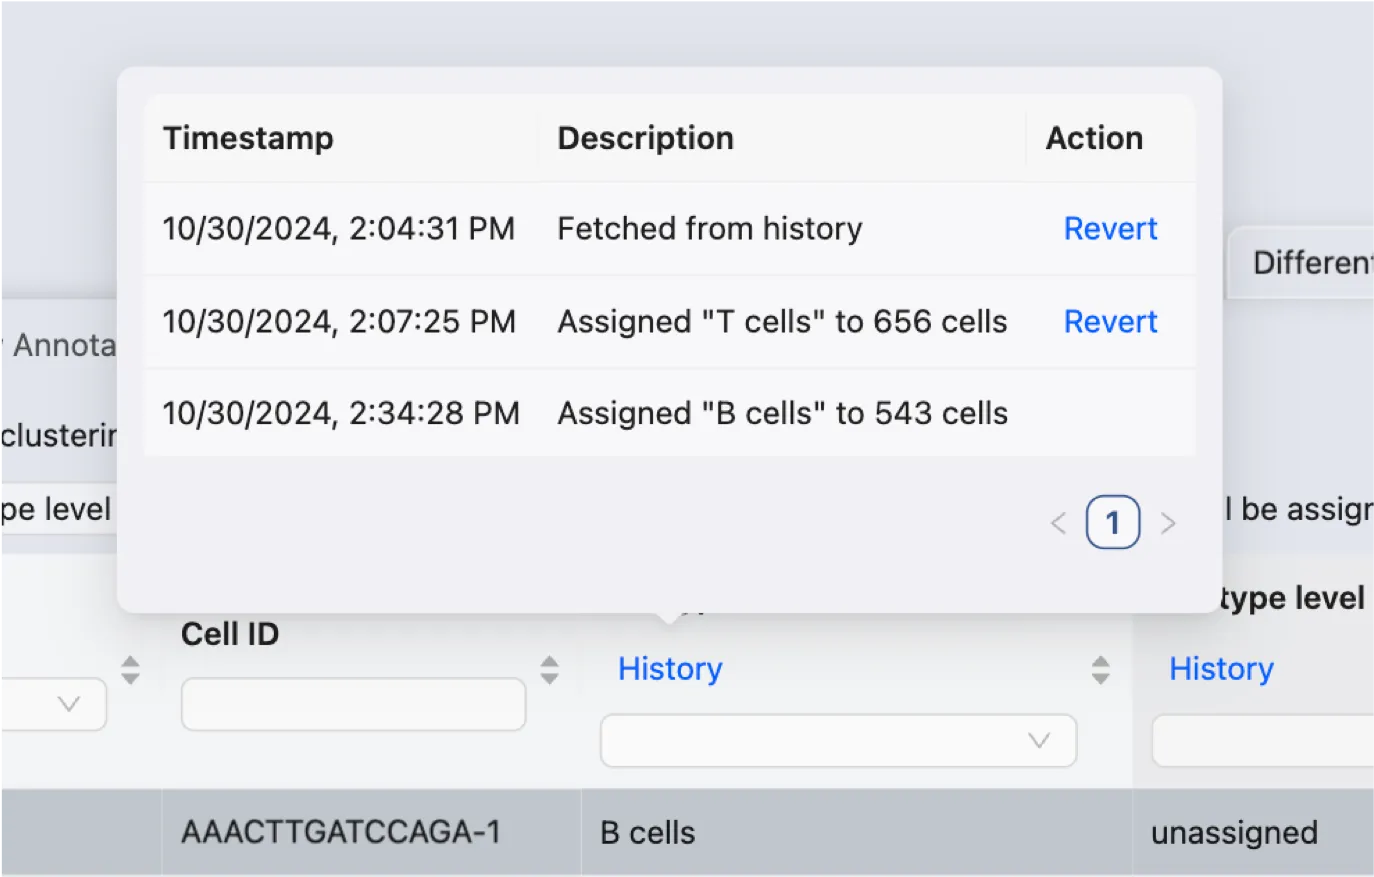
The history displays the following information:
Timestamp: The date and time when the annotation was created or last modified.
Description: The description of the change made to the annotation.
Action: Action to revert the annotation to a previous state.
Note: The history is only stored locally and will be lost if you refresh the page.