Embedding Analysis
On this page, you will find information about how to perform embedding analysis in CytoAnalyst.
What is Embedding Analysis?
Embedding analysis is a technique used to reduce the dimensionality of data while preserving the structure of the data. In CytoAnalyst single-cell RNA sequencing data analysis, embeddings are mainly used to:
Cluster cells based on gene expression profiles, and
Visualize cells in a lower-dimensional space.
Navigation

To access the Embedding analysis panel, click on the Embedding tab on the Data and Analysis Panel.
Workflow
Create New Embedding
To create a new Embedding, click on the New Embedding button.
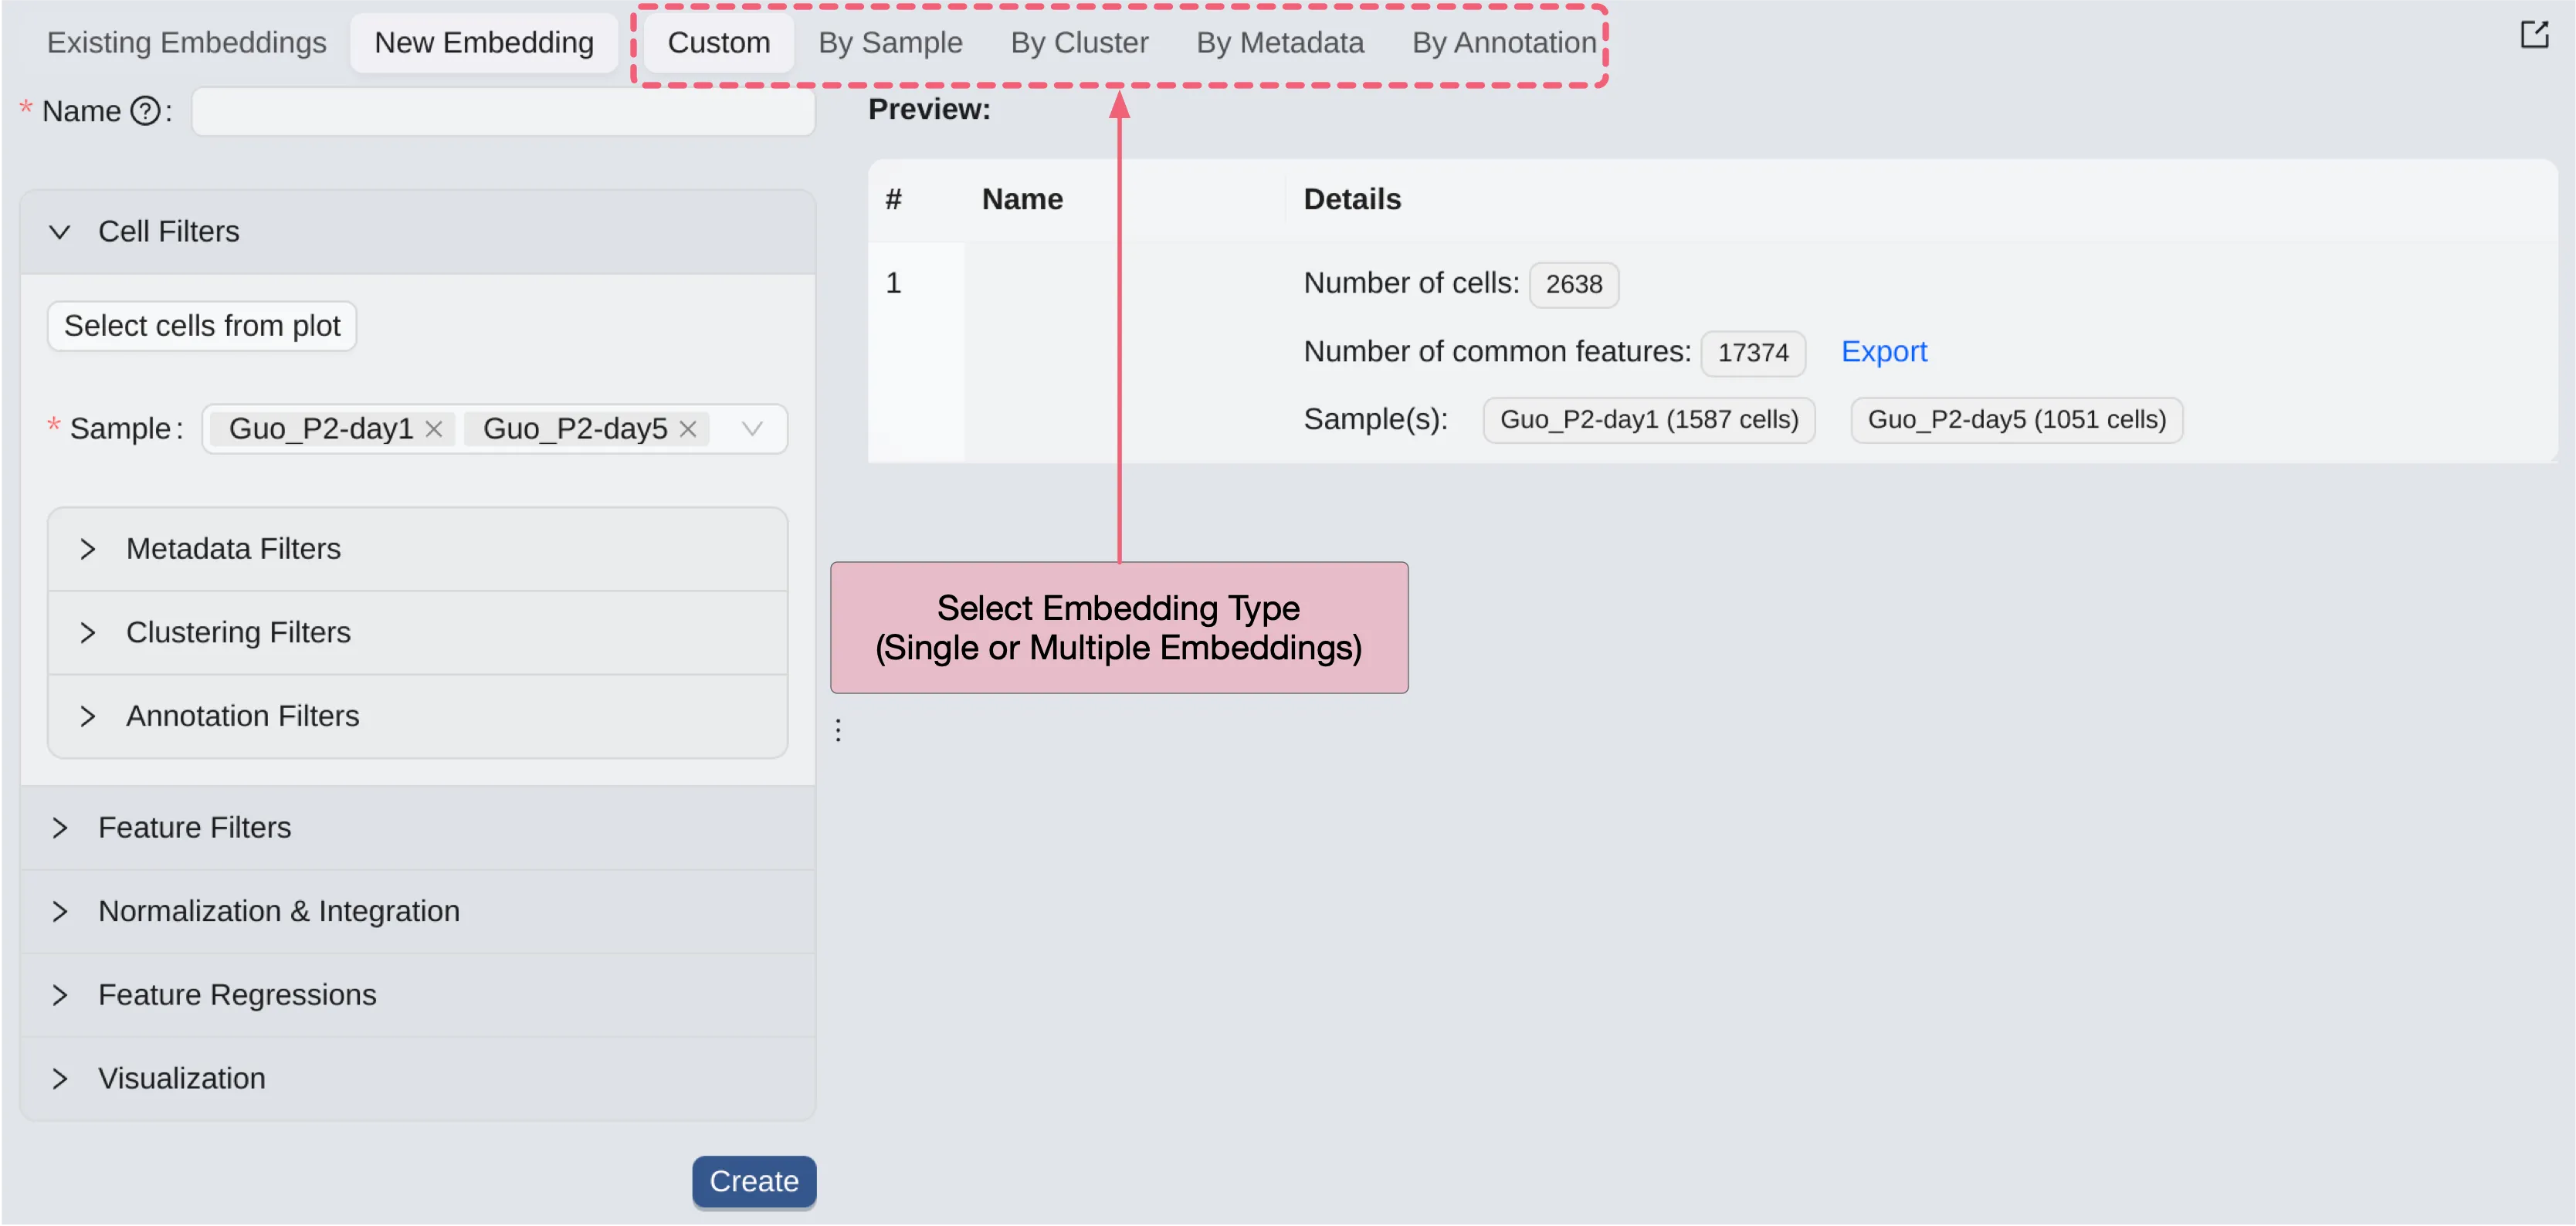
CytoAnalyst allows you to create embeddings for any subset of cells. You can create one for multiple embeddings at once. The following options are available to create embeddings:
Custom: Create a single embedding based on your selection.By Sample: Create one embedding for each selected sample.By Cluster: Create one embedding for each selected cluster.By Metadata: Create one embedding for each selected metadata value.By Annotation: Create one embedding for each selected annotation value.
For each option, you can filter cells based on different criteria to create the embedding.
Cell Filtering
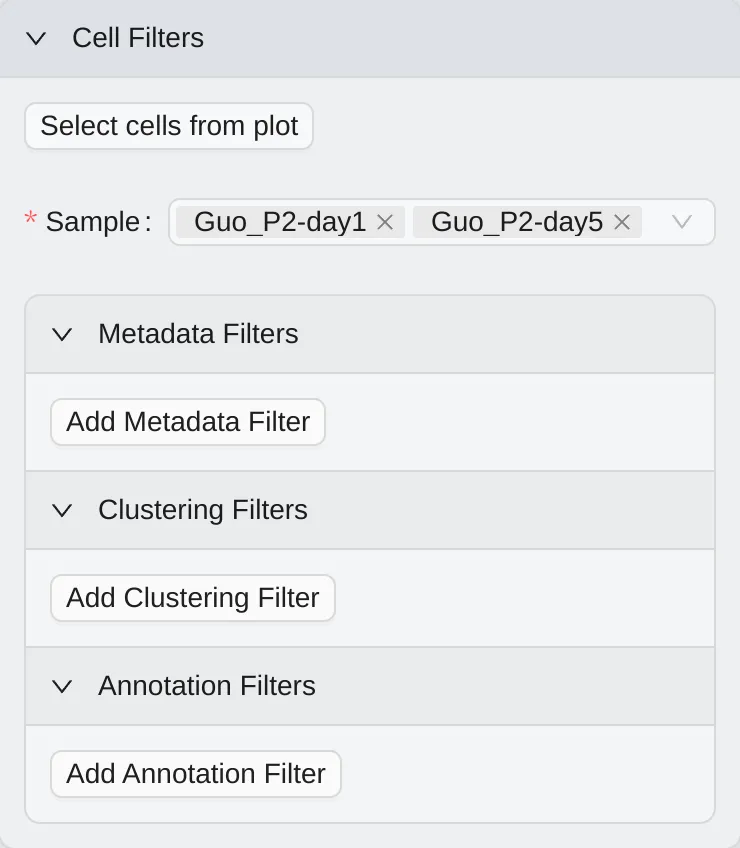
Cell filtering is used to filter cells based on different criteria. CytoAnalyst provides multiple ways to filter cells:
Select cells from plot: Select cells from visualizations.
Metadata Filters: Filter cells based on metadata.
Cluster Filters: Filter cells based on clusters.
Annotation Filters: Filter cells based on annotations.
For more details, see Cell Filtering.
Custom
Cell filters will be applied to only one embedding in the Custom option.
By Sample
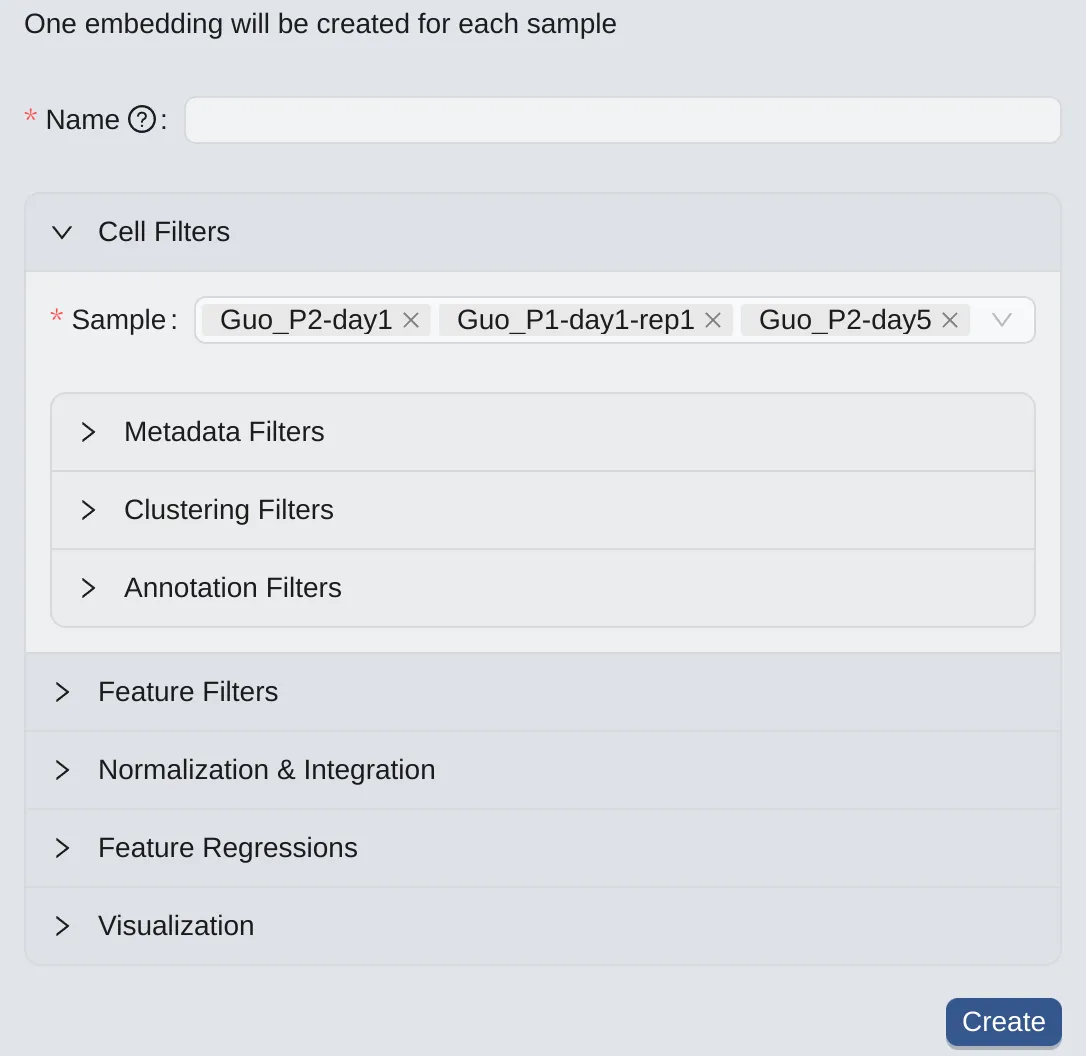
To create embeddings for selected samples (one for each selected sample), follow these steps:
Click the
By Samplebutton on to switch to the panel.On the
Cells Filtering Panel, select the desired samples (by default, all samples will be selected)
By Cluster
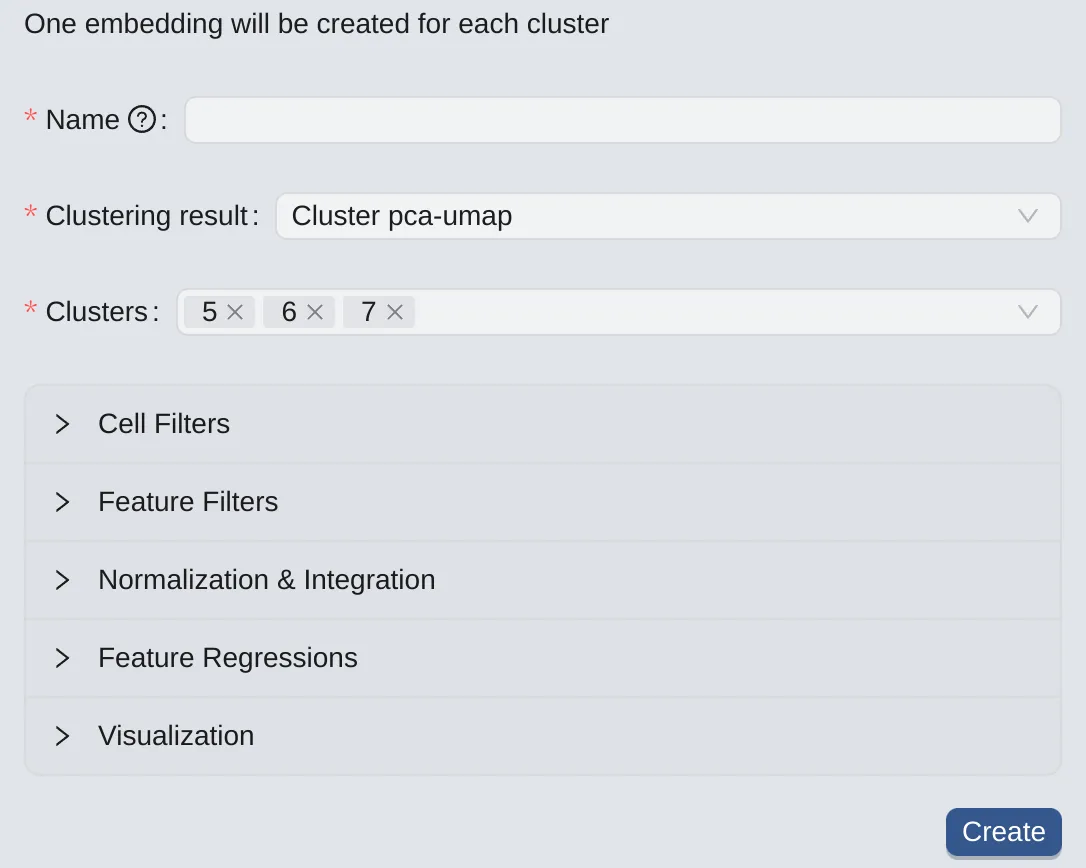
To create embeddings for selected clusters (one for each selected cluster from the chosen clustering result), follow these steps:
Click the
By Clusterbutton to switch to the panel.On the left panel, choose a clustering result.
Select the desired clusters for creating embeddings
Note: This option is available if you already have clustering results. See more at Clustering Analysis
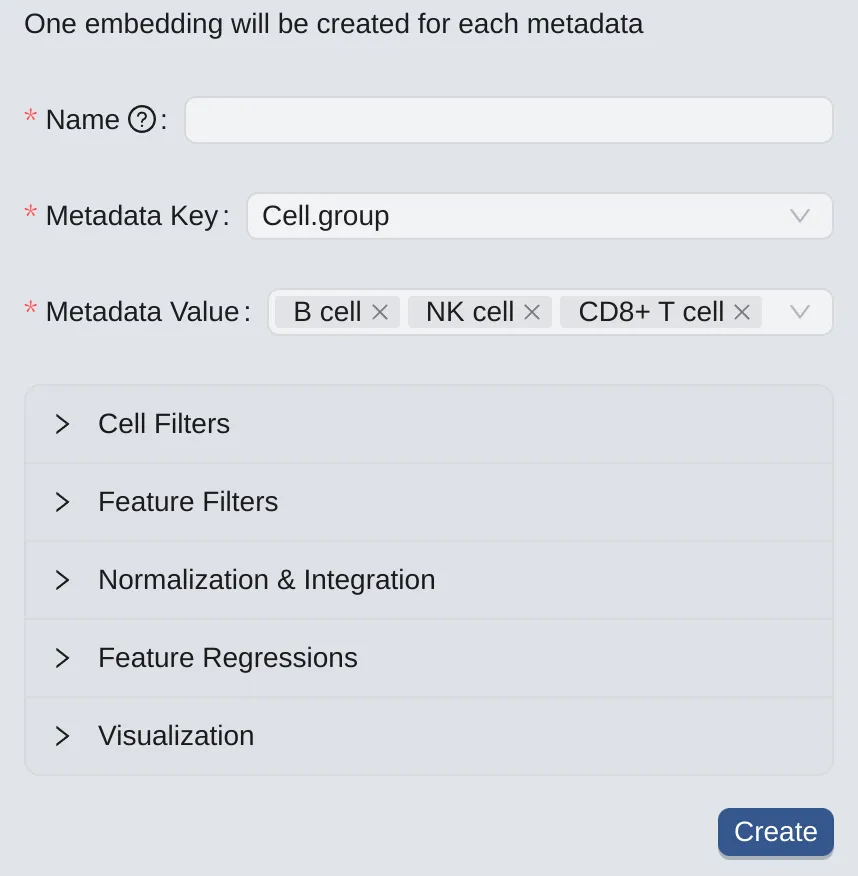
By Metadata
To create embeddings for selected metadata values (one for each metadata value from the chosen metadata), follow these steps:
Click the
By Metadatabutton to switch to the panel.On the left panel, choose a metadata key.
Select the desired metadata values for creating embeddings.
Note: This option is available if you have already chosen to keep metadata on the Data Upload page. See more at Data Management
By Annotation
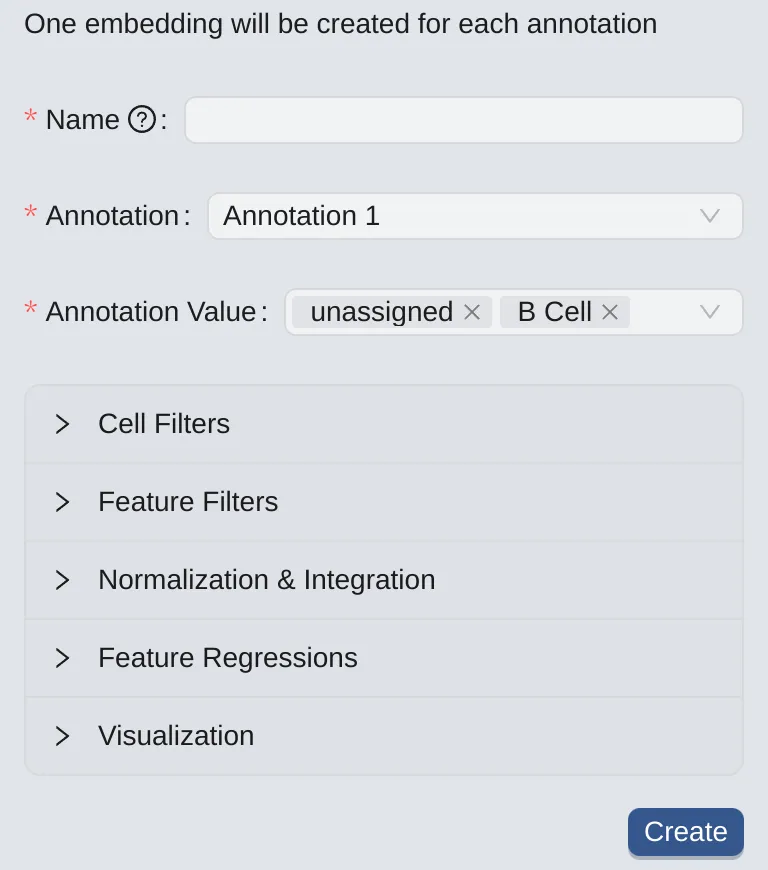
To create embeddings for selected annotation values (one for each annotation value), follow these steps:
Click the
By Annotationbutton to switch to the panel.On the left panel, choose an annotation.
Select the desired annotation values for creating embeddings.
Note: This option is available if you already have an annotation. See more at Cell Annotation
Feature Filters
To filter features, click the Feature Filters to expand the panel. Then:
Enable the
Filter features by gene setoption.Select available
Gene Set Collection.Select available
Gene Sets.
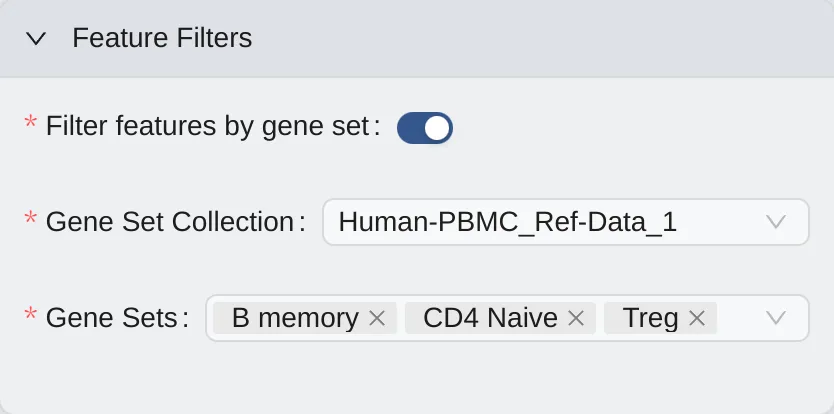
Note: This option is available if you already have at least one gene set collection. See more at Gene Set Collection
Normalization & Integration
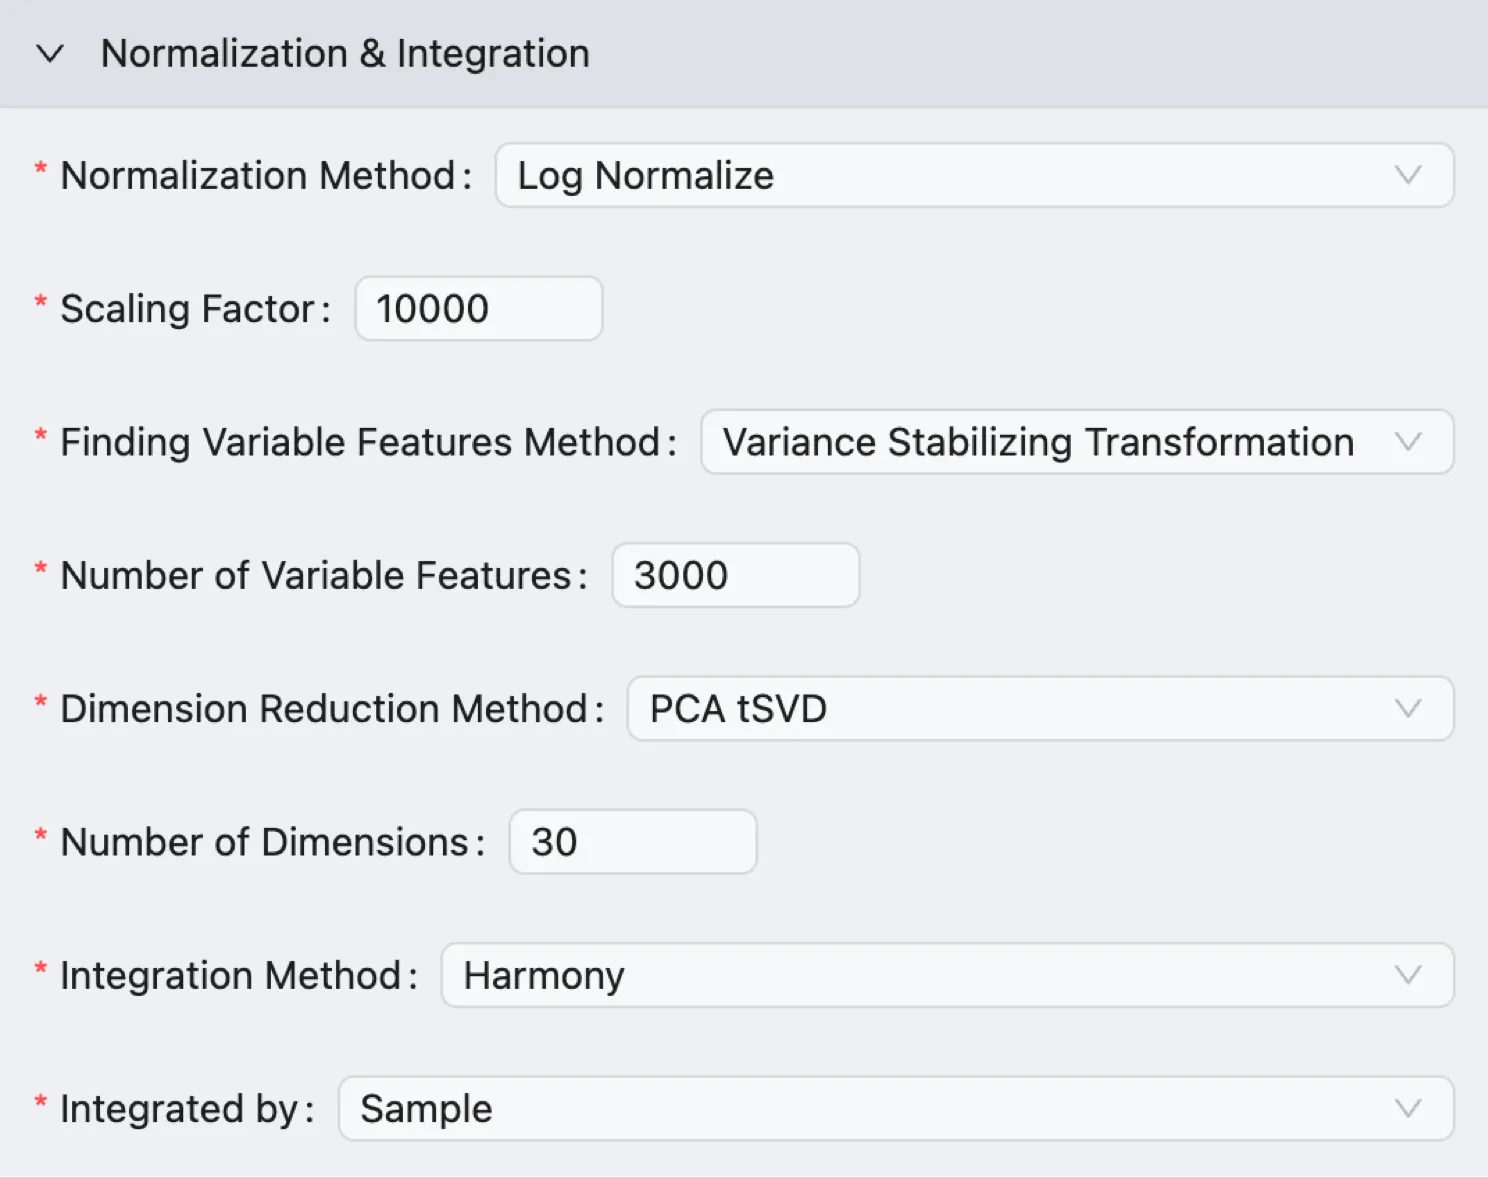
Select the Method and Parameters for Normalization and Integration.
Normalization Method: Select the method to normalize the data. Options include
Log NormalizeandscTransform.Scaling Factor: The numerical value used to scale the gene expression measurements during the normalization process.
Finding Variable Features Method: Select the method to identify variable features. Options include
Variance Stabilizing Transformation,Mean Variance Plot, andHighest Dispersion.Number of Variable Features: Define the number of variable features to identify.
Dimension Reduction Method: Whether to use a faster approximation method (Truncated Singular Value Decomposition) to calculate the Principal Components. CytoAnalyst supports the following methods:
PCA: Runs the standard, mathematical exact PCA algorithm. This method is precise but can be computationally intensive on very large datasets.PCA tSVD: Uses a faster, approximate method called Truncated Singular Value Decomposition. This is highly recommended for large datasets to significantly reduce processing time while providing nearly identical results for downstream analysis.
Number of Dimensions: The number of principal component analysis (PCA) dimensions to compute.
Integration Method: Select the method for integrating data. Options include:
Anchor-based CCA integration: Uses Canonical Correlation Analysis (CCA) to find pairs of cells (one from each dataset) that are in a similar biological state. These cell pairs are called anchors. The algorithm then uses these anchors to calculate correction vectors that pull the datasets together, aligning the shared cell populations.Anchor-based RPCA integration: Utilizes a Reciprocal Principal Component Analysis (RPCA) approach to find anchors and align datasets. This method is similar to the CCA integration, but a key improvement is its reciprocal nature, which is less likely to be confused if one dataset contains a cell type that is absent in another. It effectively ignores genes that are only variable due to a batch-specific effect, making the anchor identification more robust.Harmony: Employs a fast, iterative clustering-based algorithm to embed all datasets into a single, corrected space. This method is highly valued for its speed and efficiency, especially in large datasets or those with complex batch designs.None: Choose this option if you only analyze a single dataset or do not want to perform integration.
Integrated by: Defines the variable that the algorithm uses to identify the different groups or batches of cells that require correction. CytoAnalyst supports the following options:
Sample: Choose this when you are combining data from different individuals, tissues, or experimental time points, and each sample was processed as a separate unit.Metadata: Choose this when the primary source of technical variation is not just the sample original but another known factor. This is common when samples are processed in different ways (e.g., using different antibody panels or sequencing chemistries) or when you want to combine cells based on a biological grouping that spans across multiple samples.
Feature Regressions
To regress Mitochondrial, Ribosomal, and Cell Cycle genes out of the data, follow these steps:
Click the Feature Regressions to expand the panel.
Regress Mitochondrial Genes:
Enable this option to regress out
Mitochondrialgenes.Use the default
Mitochondrial Genes Regexstring or edit the regex string as needed.
Regress Ribosomal Genes:
Enable this option to regress out
Ribosomalgenes.Use the default
Ribosomal Genes Regexstring or edit the regex string as needed.
Regress Cell Cycle Genes:
Enable this option to regress out
Cell Cyclegenes.Cell Cycle S Phase Genes: Use the list of defaultCell Cycle S Phasegenes or edit with your own list for the regression.
Cell Cycle G2M Phase Genes: Use the list of defaultCell Cycle G2M Phasegenes or edit with your own list for the regression.Regress Cell Cycle Difference: Enable this option to remove the variation in cell cycle phase between proliferating cells from data.
Compute Pre-Regressed Data for Comparison:
Enable this option if you want to observe the comparison before and after regression.
Visualization
Select the visualization method for the embedding. CytoAnalyst supports the following visualization methods:
UMAP(Uniform Manifold Approximation and Projection): A modern and powerful algorithm that excels at showing both local cell clusters and the broader, global relationships between them.Recommendation: This is the recommended default for most analyses. It is fast and provides an intuitive and balanced view of the data's structure.
t-SNE(t-distributed Stochastic Neighbor Embedding): A classic visualization method that is excellent at separating individual cell clusters into clear, distinct groups.Recommendation: Use this if you want to emphasize the separation between closely related cell types, but be aware that the distances between clusters are often not meaningful.
PCA(Principal Component Analysis): A linear method that displays the data based on the highest sources of variation.Recommendation: While generally less effective than UMAP or t-SNE for separating complex cell types, PCA plots are very useful for getting a quick overview and diagnosing major technical effects (like batch effects).
UMAP Visualization
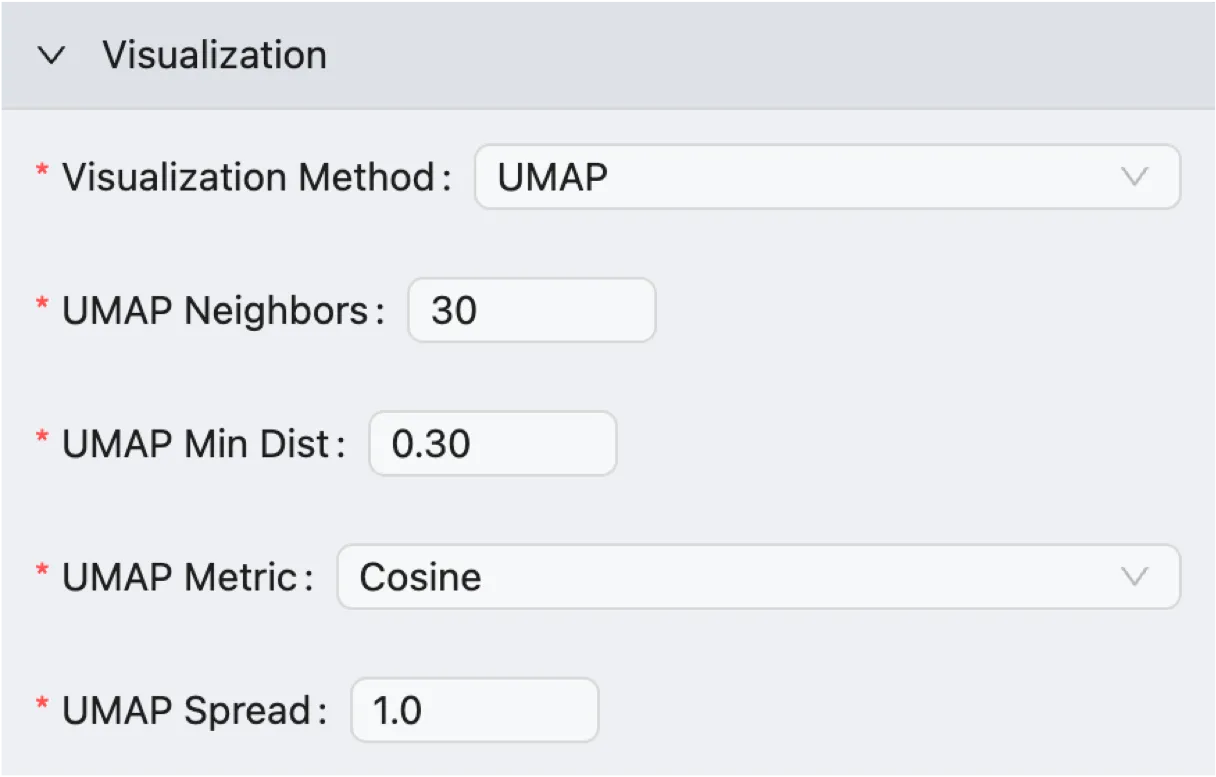
UMAP Neighbors: Controls how UMAP balances the local and global structure in the visualization.
Low Values (e.g., 5): Forces the algorithm to focus on very fine-grained local structure, which can be useful for separating rare subtypes but may break up larger, related cell populations.
High Values (e.g., 50): Pushes the algorithm to consider more of the global structure, which is better for showing the relationships between clusters but may obscure finer details.
UMAP Min Dist: Controls how tightly UMAP packs the points together.
Low Values (e.g., 0.01): Allows points to be very close together, resulting in dense, tightly-packed clusters. This is useful when you want to emphasize the separation between groups.
High Values (e.g., 0.5): Prevents the algorithm from clumping points too tightly, resulting in a more even, spread-out visualization that can better represent the data's broader topology.
UMAP Metric: Determines the formula used to calculate the distance between cells in the high-dimensional space before visualization. CytoAnalyst supports the following metrics:
Euclidean: The standard, straight-line distance between two points in the PCA space.
Cosine: Measures the angle between two points, rather than the distance.
UMAP Spread: This parameter works in combination with
UMAP Min Distto control the effective scale of the embedded points. A larger spread value results in a more spread-out and less clumped embedding, which can be useful for visualizing the overall structure of the data.
t-SNE Visualization

t-SNE Perplexity: Controls the balance between preserving the local and global aspects of your data's structure.
Low Values (e.g., 5-10): Force the algorithm to focus only on the immediate neighbors of each cell. This can be useful for preserving the structure within very small, distinct clusters but may fail to capture the broader relationships between clusters.
High Values (e.g., 50): (e.g., 50-100): Push the algorithm to consider more neighbors for each point, which can help reveal the global structure of the data. However, if the perplexity is set too high, it can cause distinct clusters to merge incorrectly. The perplexity value should not be larger than the number of cells in your dataset. A typical value is
30.
PCA Visualization

This method visualizes cells based on the first two principal components (PC1 and PC2), which represent the directions of the greatest variance in the data.
While it is less effective than UMAP or t-SNE at separating nuanced cell clusters, a PCA plot is an essential diagnostic tool.
It's excellent for getting a high-level overview of the data's structure and for quickly identifying major effects, such as technical differences between batches or broad biological lineages.
Preview
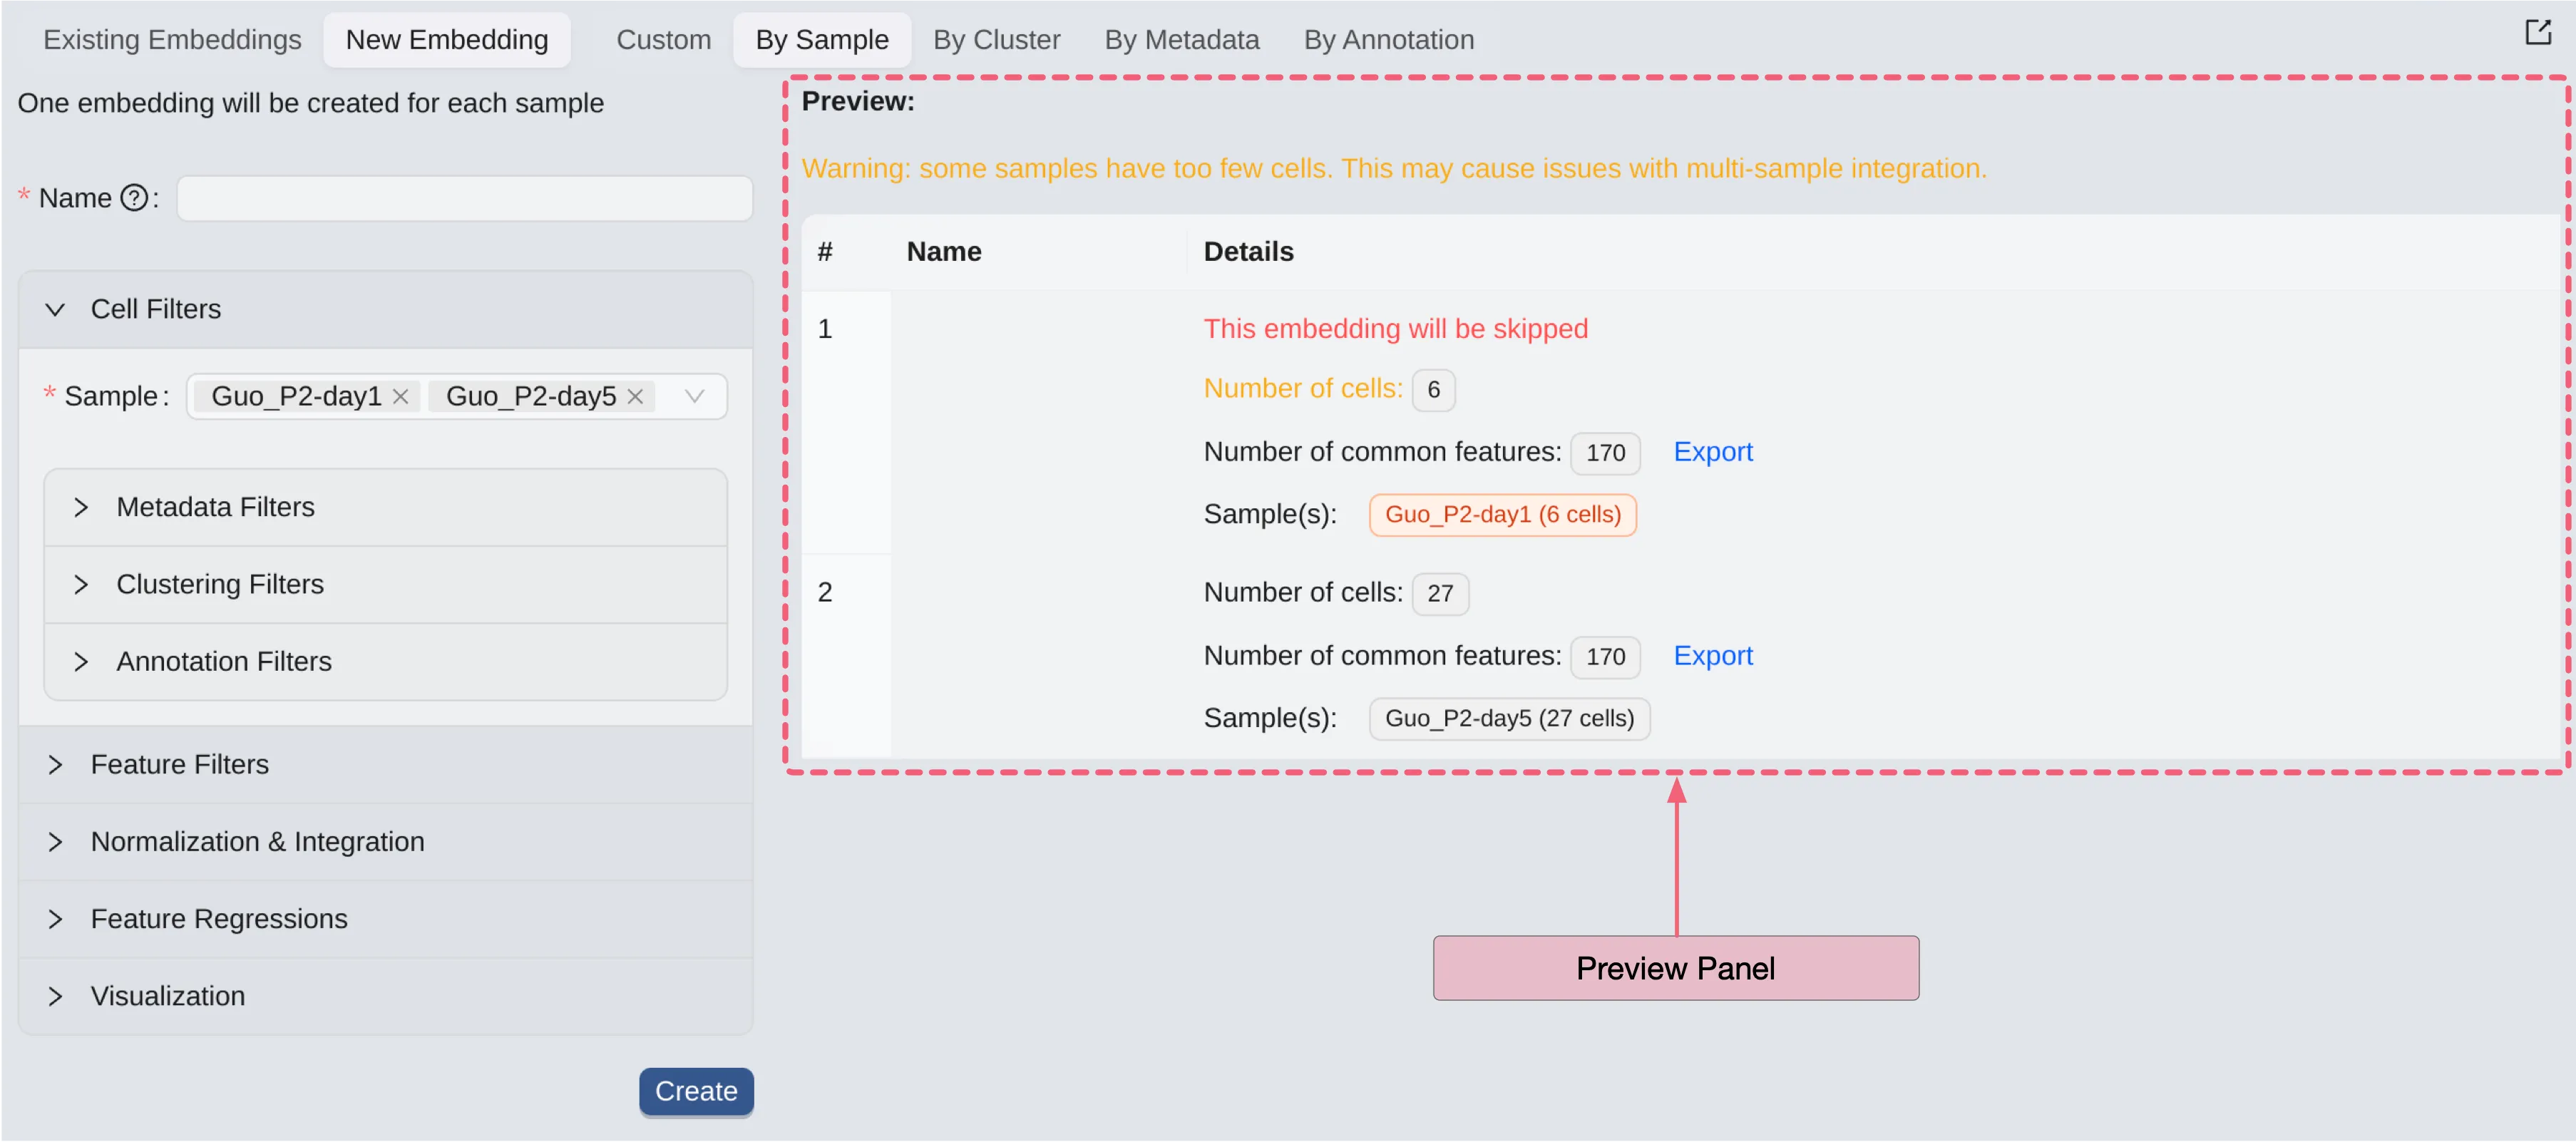
After selecting cell filters, feature filters, feature regression values, normalization method, or visualization method; you can preview the embeddings that will be created.
In this preview table, you can see the details of the embeddings that will be created:
Name: The name of the embedding.
Details: Brief information about data of the embeddings, including:
Red text:
This embedding will be skippedindicates that this embedding will not be created because some filters cause it to not meet the criteria for creating embeddings.Number of cells: The total number of selected cells.Number of common features: The total number of selected features.Sample(s): The selected samples along with their respective number of cells.
Finally, click the Create button to submit the embedding creation job.
Existing Embeddings
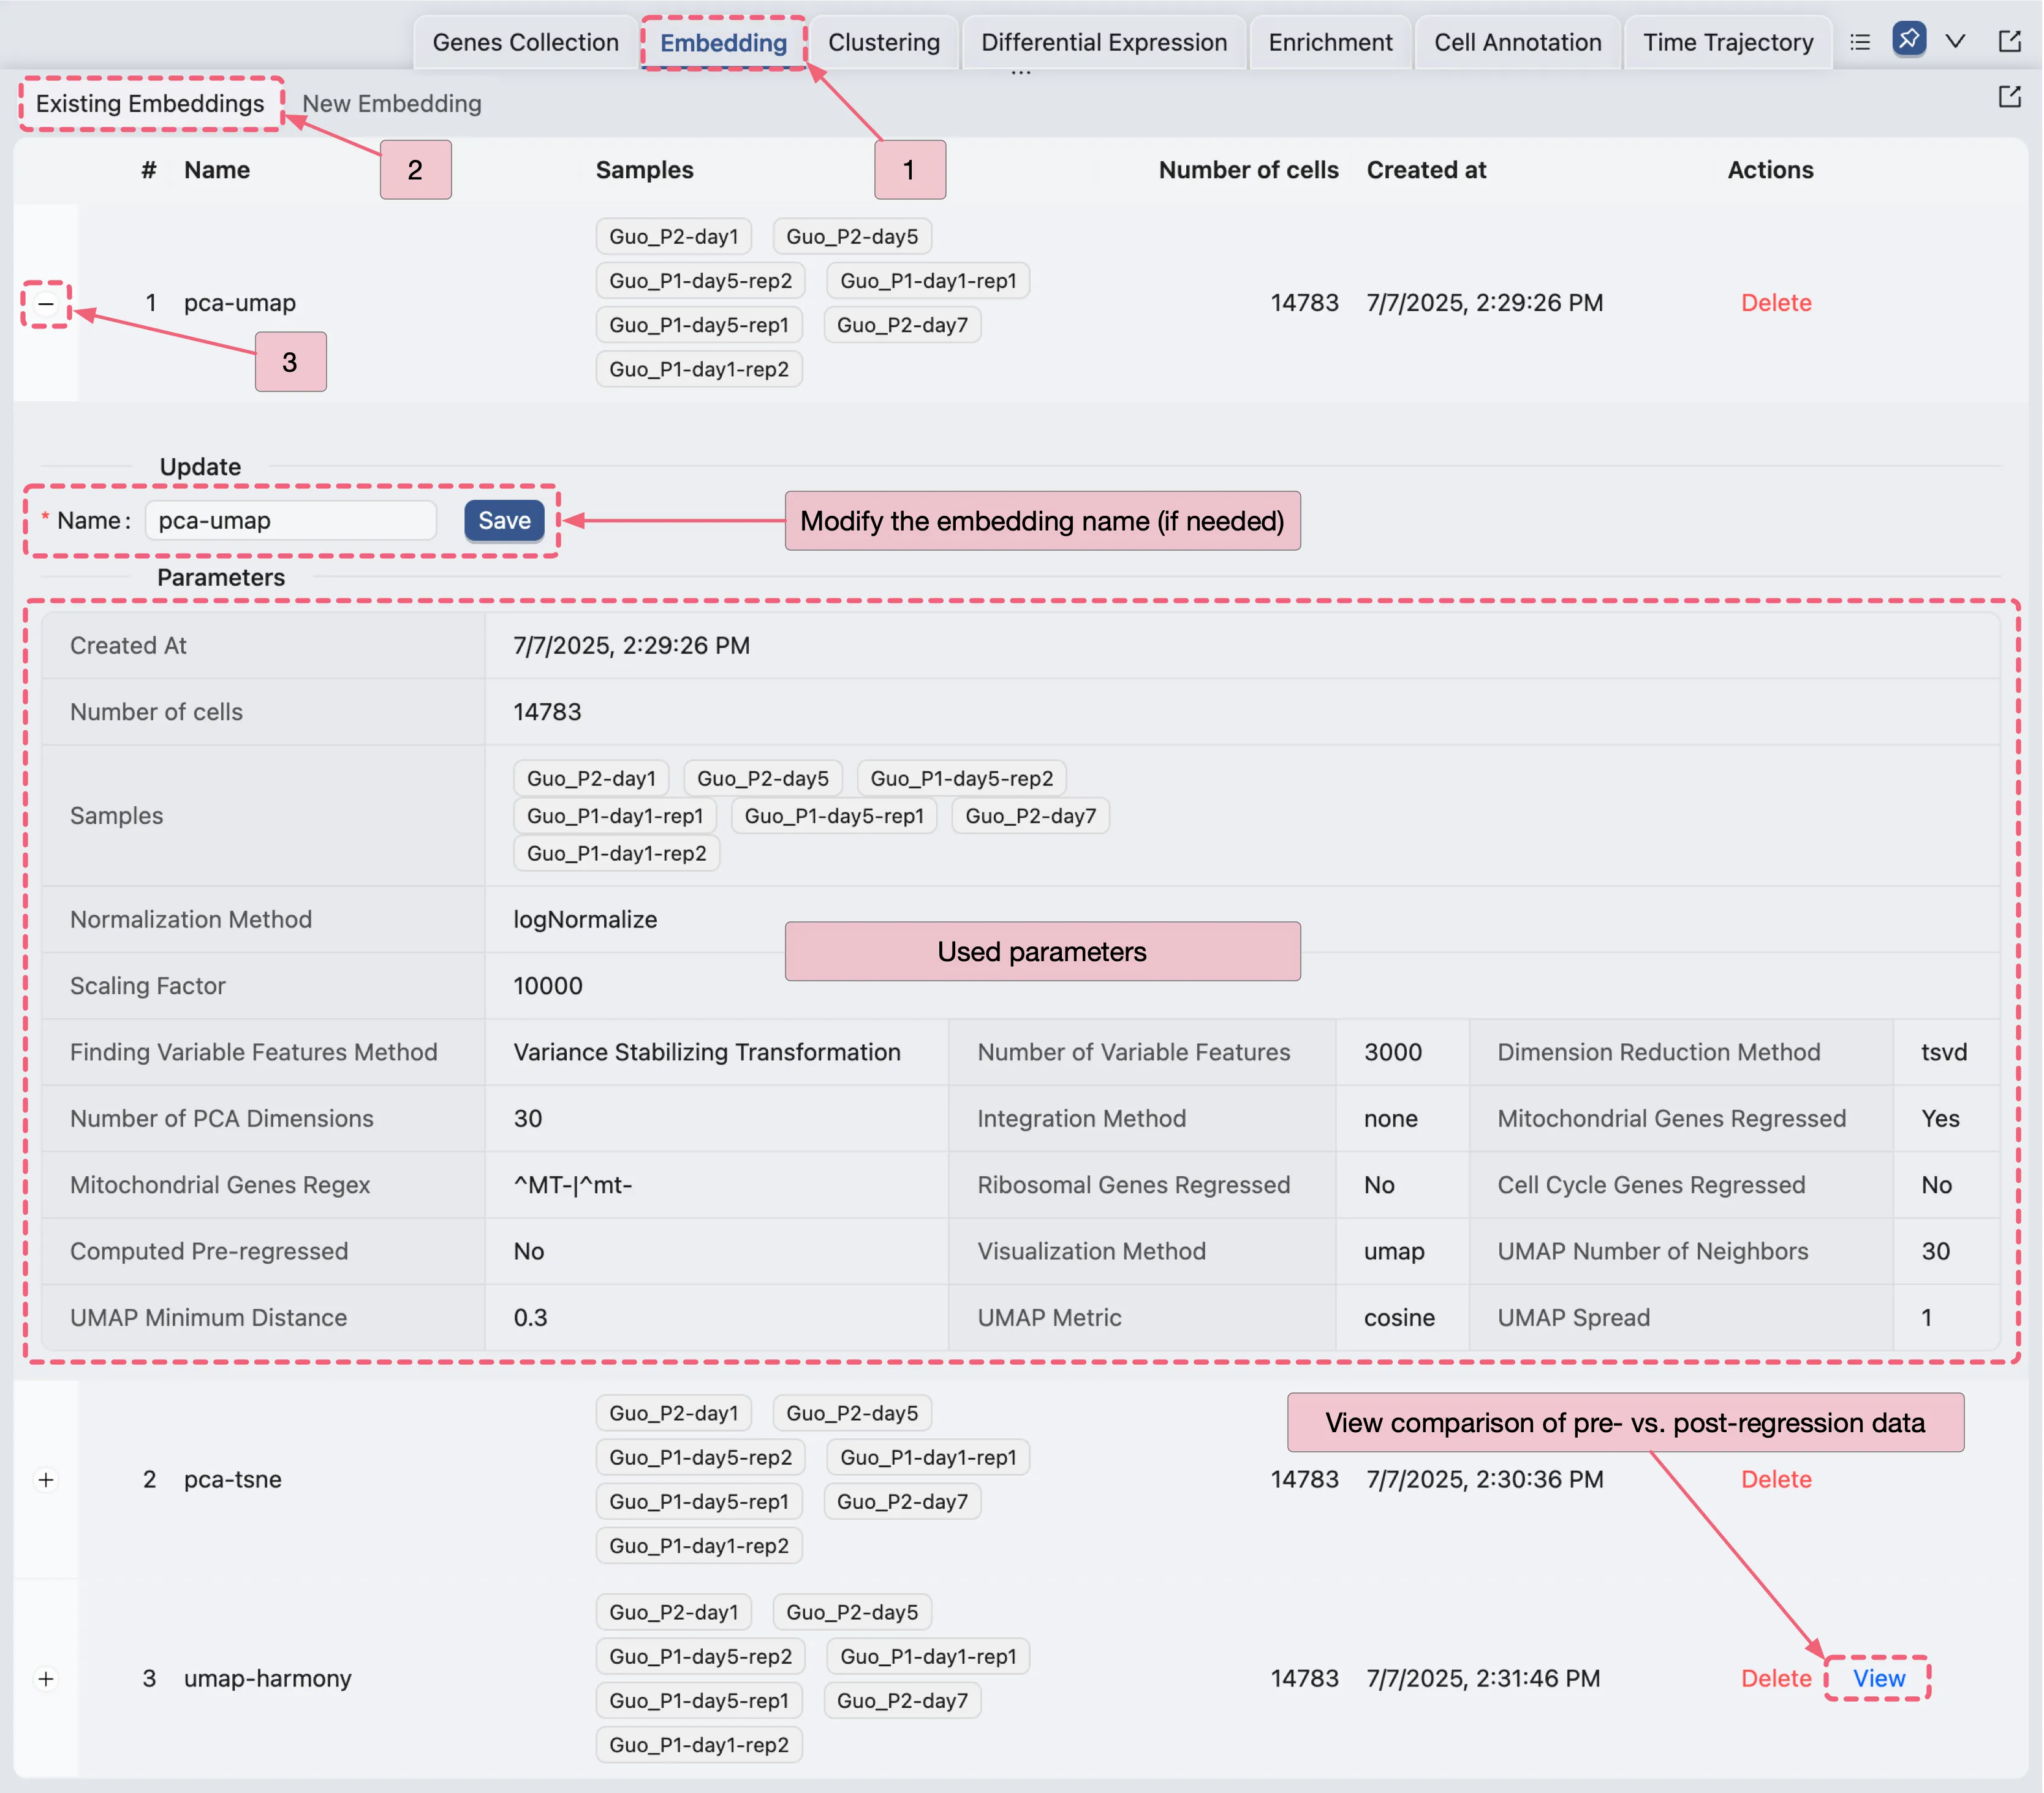
Once the embedding creation job is completed, you can view the existing embeddings in the Existing Embeddings Panel. To access the existing clustering table, follow these steps:
Click on the
Embeddingtab on the bottom drawer.Click on the
Existing Embeddingstab.
On the existing embeddings table, you can see all the embeddings you have created. To view the details of a specific embedding analysis, click the ![]() icon next to the embedding name to expand it.
icon next to the embedding name to expand it.
On the expanded view, you can see the following details:
Name: The name of the clustering analysis (you can modify the name by clicking on it and pressing
Saveto save the changes).Parameters: The parameters used for the clustering analysis.
To observe the comparison between pre-regressed and post-regressed Mitochondrial, Ribosomal, or Cell Cycle genes by clicking the View button.
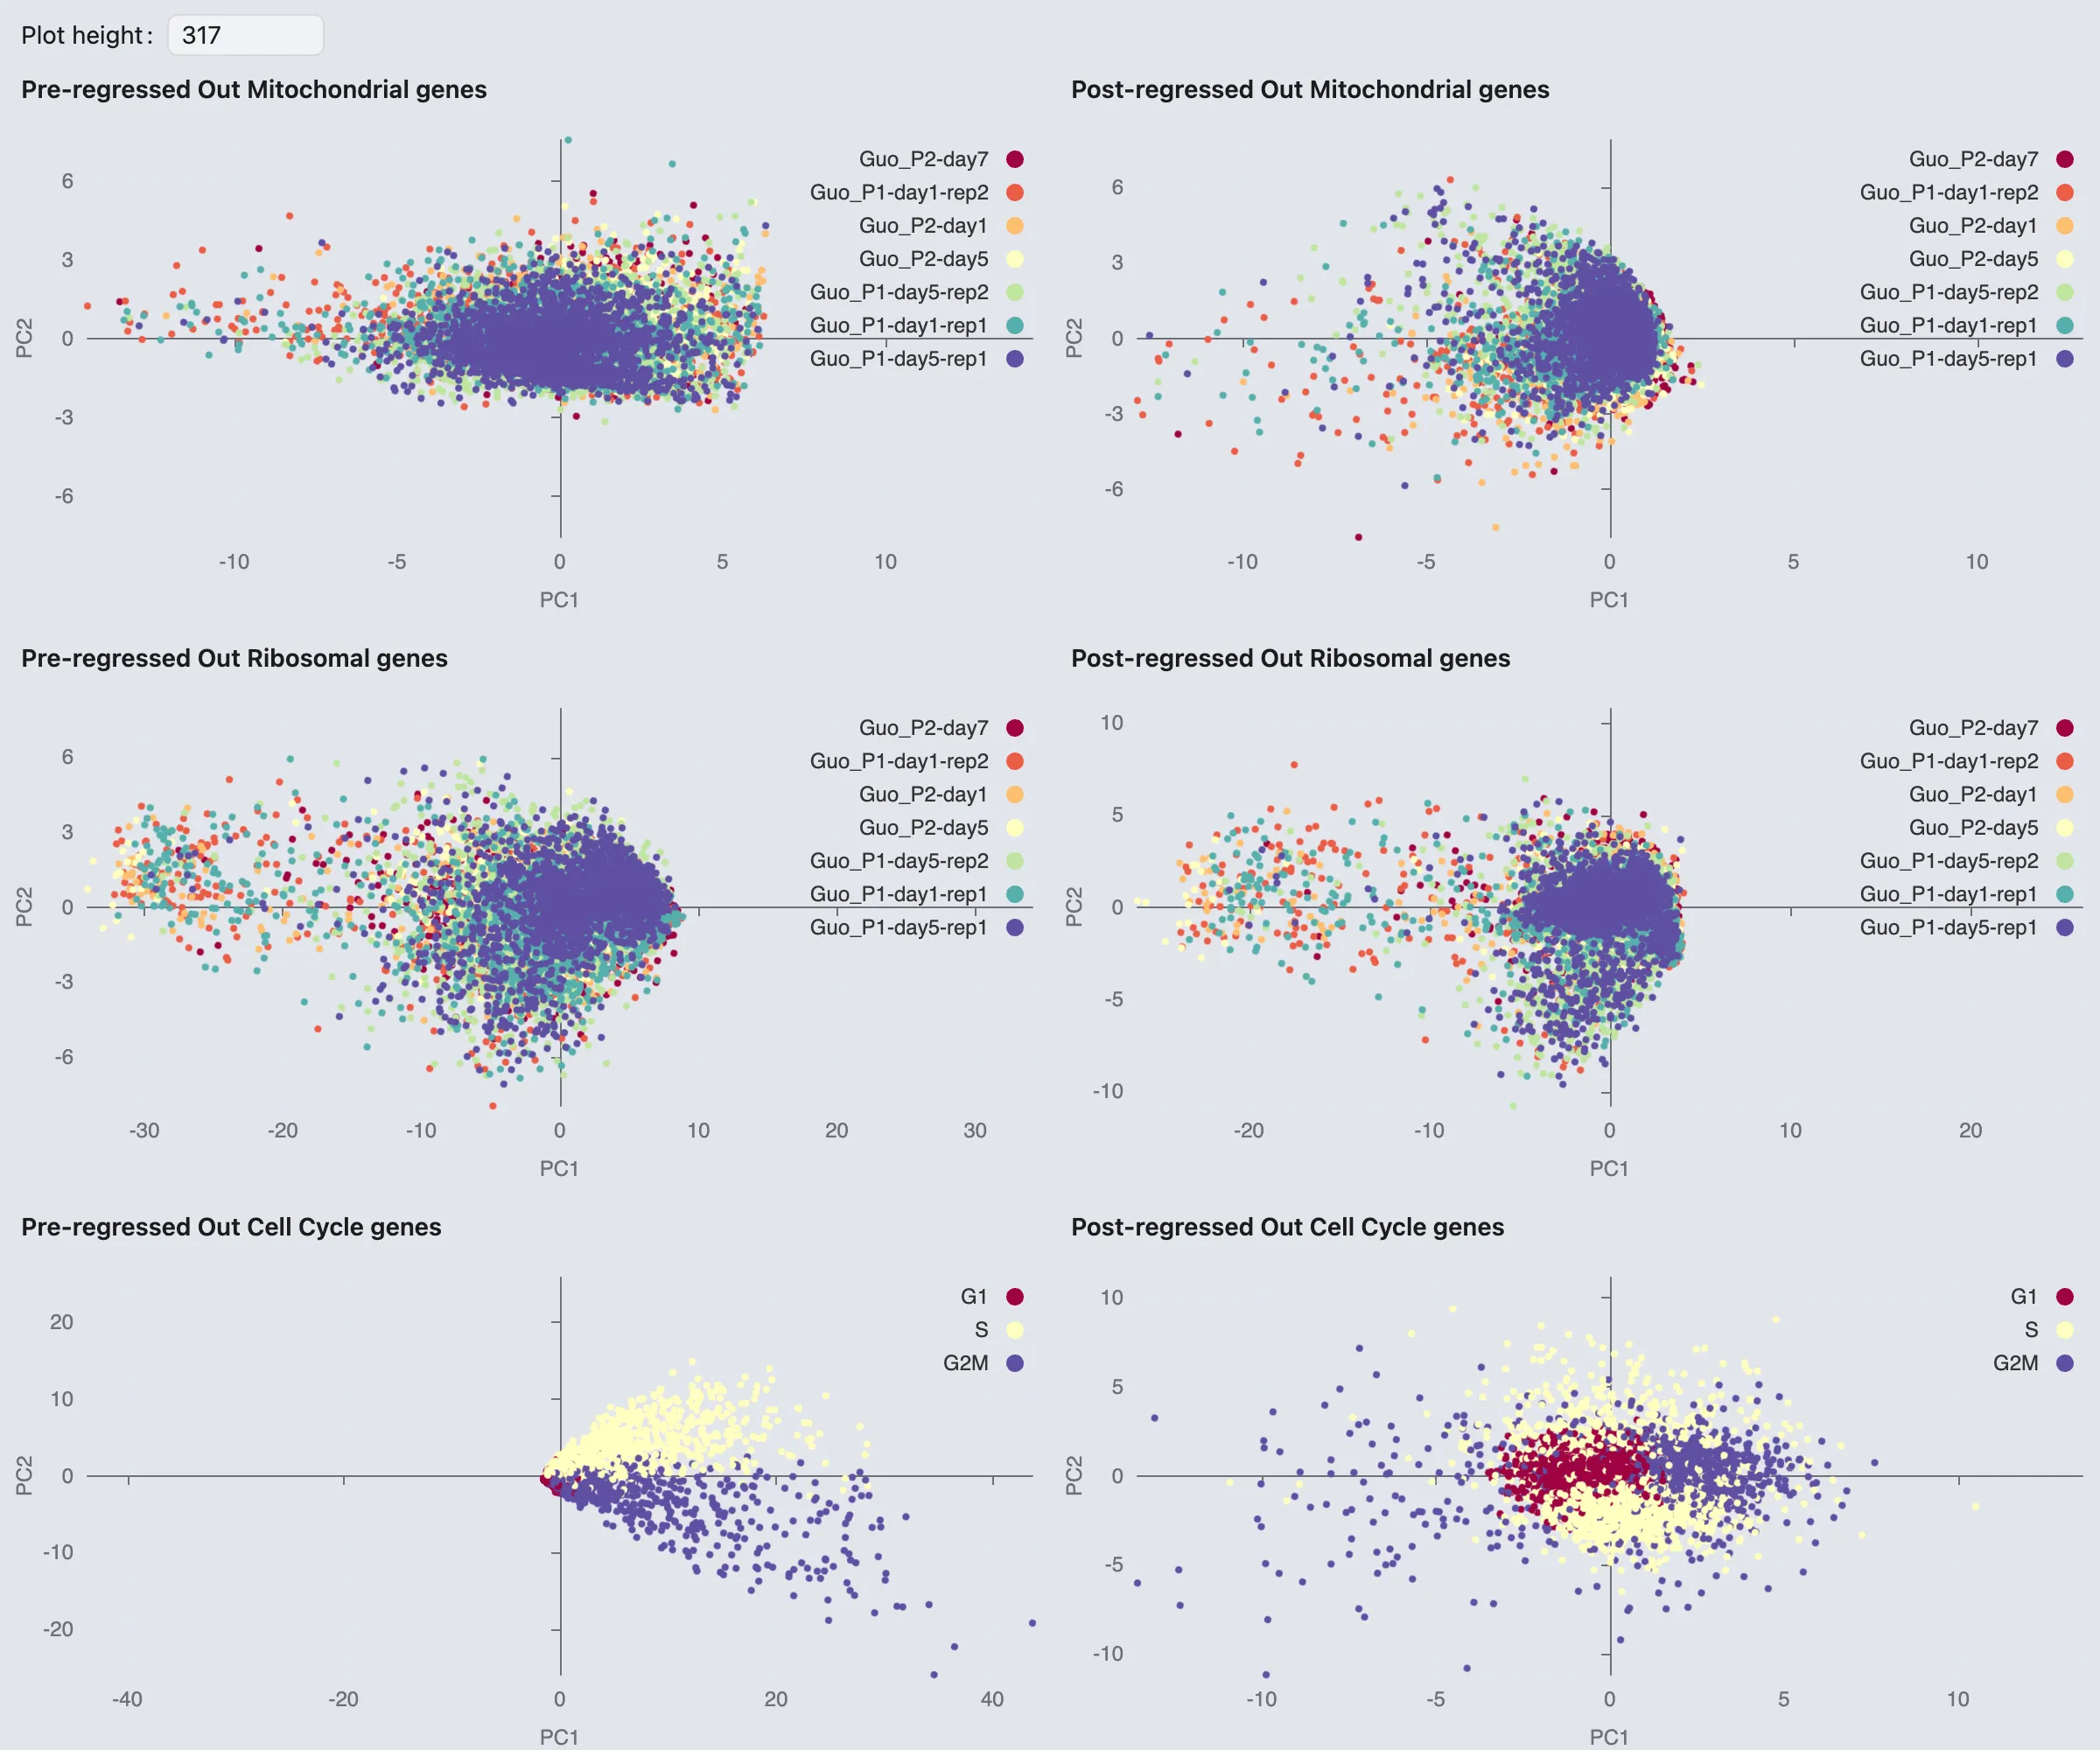
Note: This option is only available if you have enabled the Compute Pre-Regressed Data for Comparison option in the Feature Regressions section during the embedding creation process.