Clustering Analysis
What is Clustering Analysis?
Clustering analysis is a method used to group similar cells together based on their gene expression profiles. Cells are normally grouped into clusters using unsupervised machine learning algorithms on the embedding space.
Navigation
To access the Clustering Analysis panel, click on the Clustering tab on the Data and Analysis Panel.

Workflow
Create New Clustering
Before you can perform clustering analysis, you must create embeddings. View the Embedding Analysis documentation to learn how to create embeddings.
Follow these steps to create a new clustering analysis:
Click the Clustering tab on the bottom drawer.
Click the New Clustering button to open the clustering creation form.
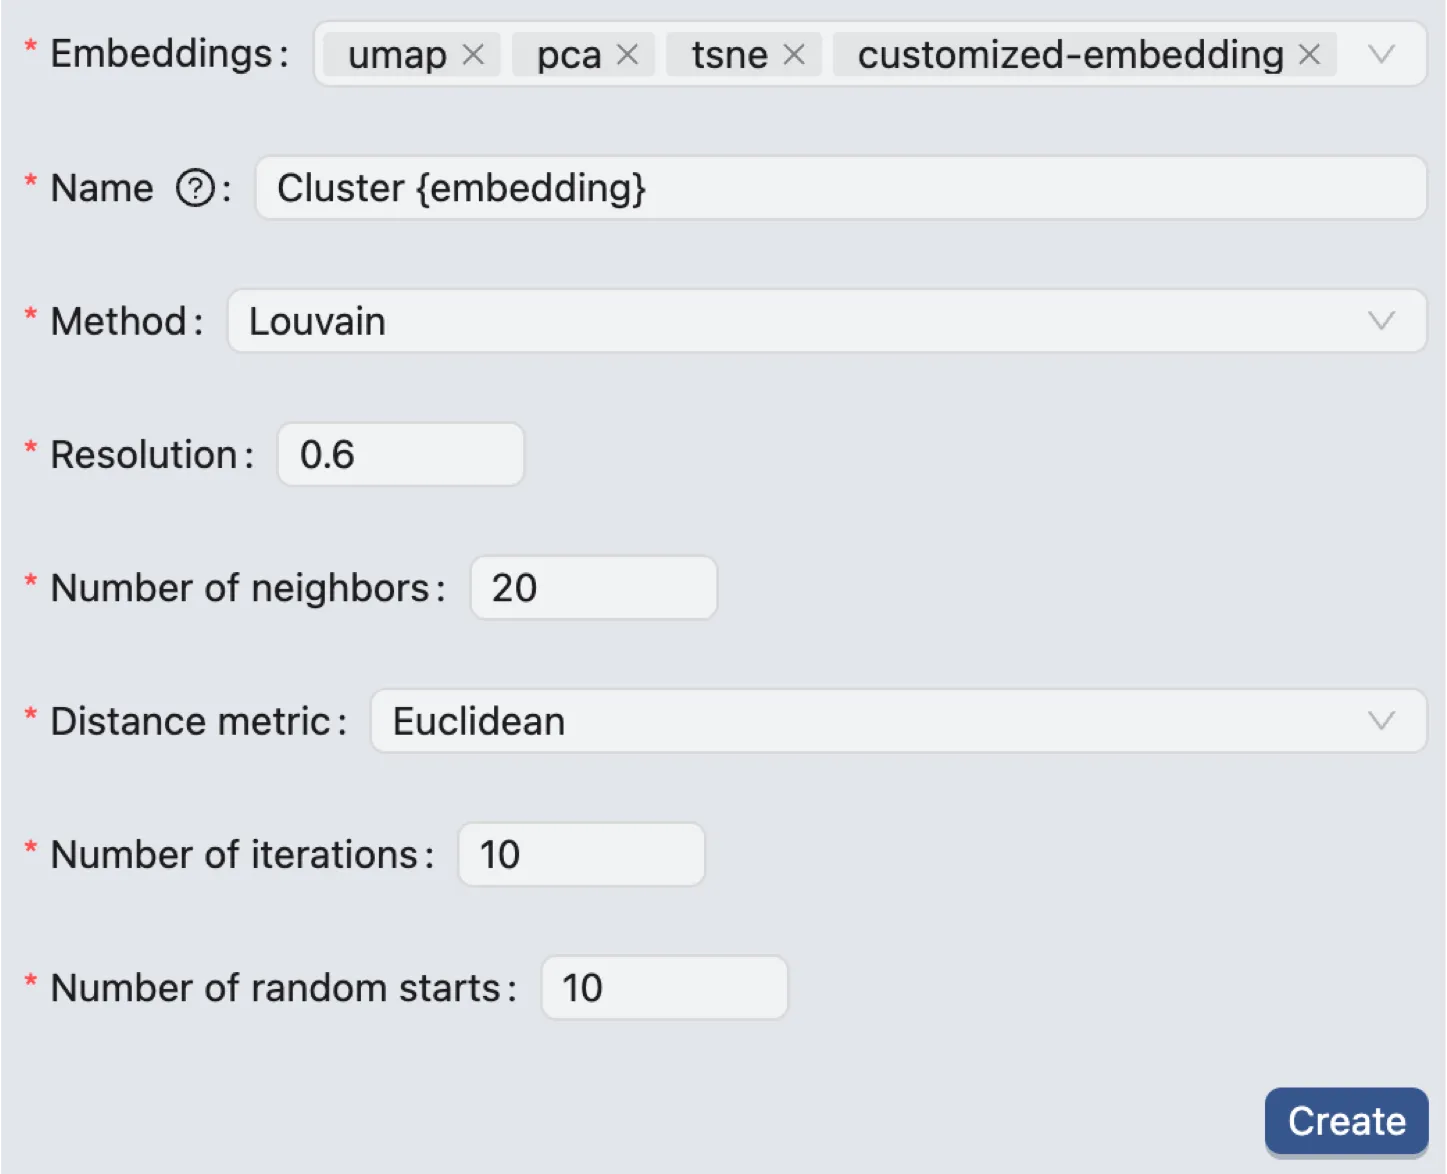
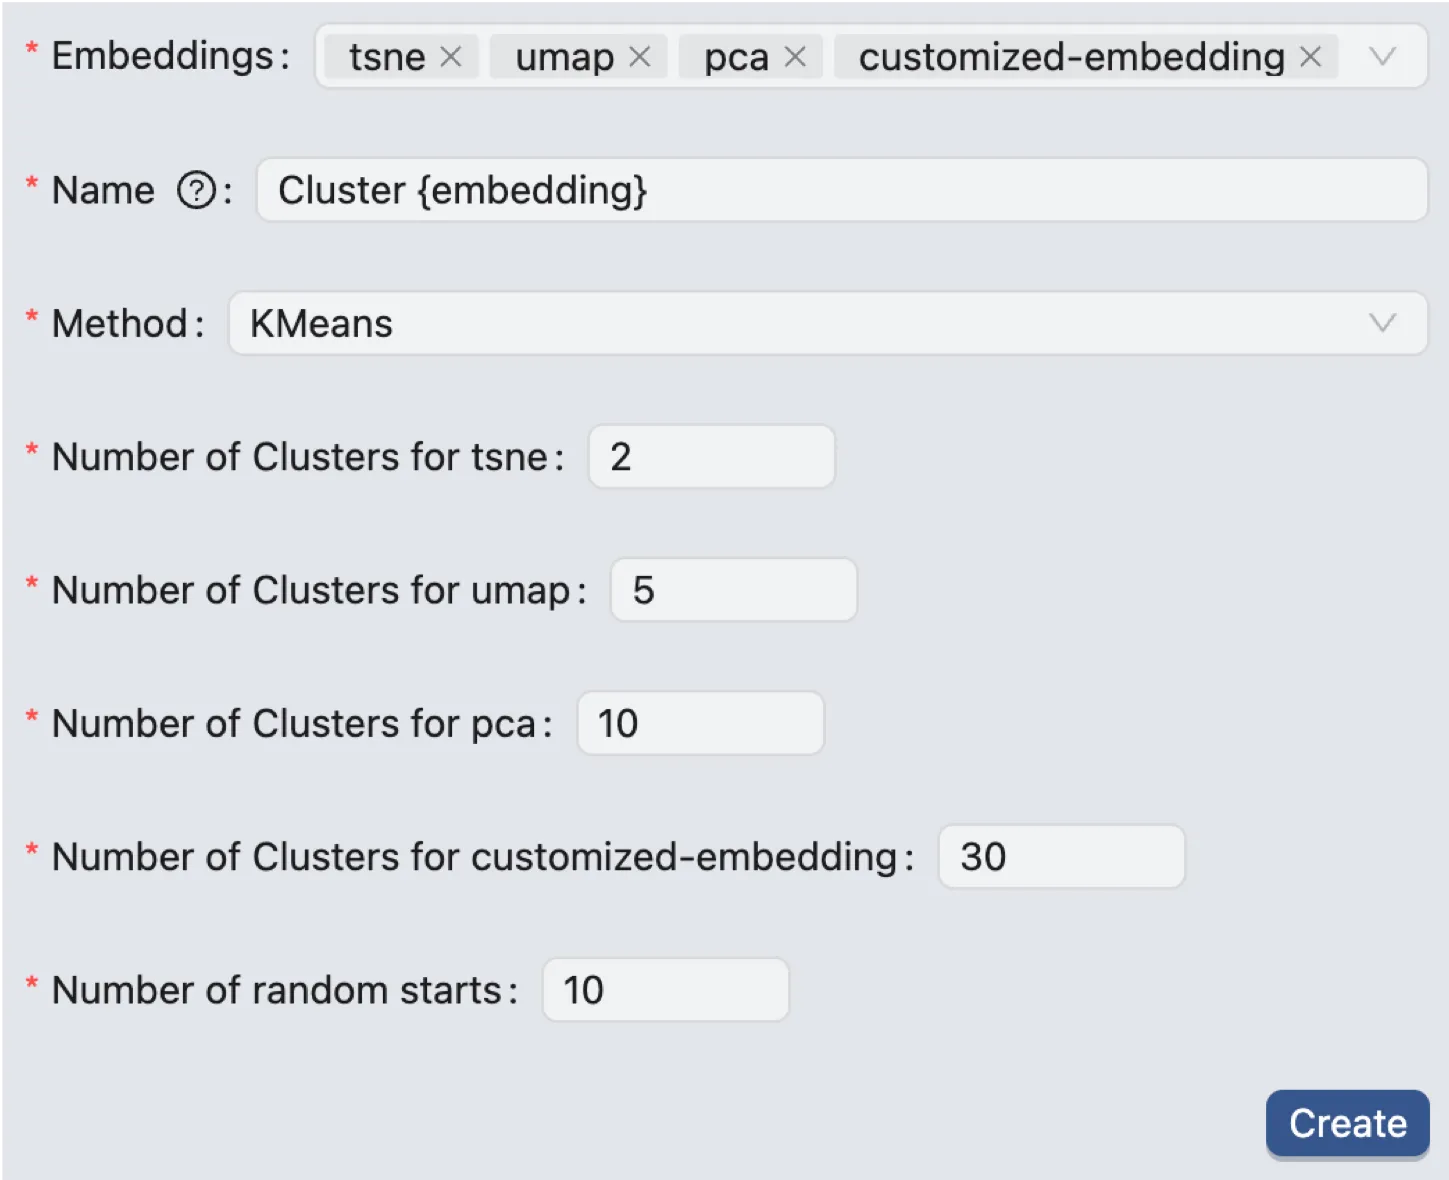
Select the embeddings you want to use for clustering (you can select multiple embeddings).
Enter a name for the clustering. The name can include
{embedding}which will be replaced by the name of the selected embedding (e.g.,Clustering {embedding}will becomeClustering PCAif the selected embedding isPCA).Select the clustering method you want to use. CytoAnalyst supports the following clustering methods:
Louvain: A community detection algorithm based on modularity optimization.
Leiden: An improved version of the Louvain algorithm.
K-means: A partitioning algorithm that divides the data into
kclusters.

Louvain and Leiden Clustering

After selecting the embeddings, enter a name for the clustering and select the clustering method (Louvain or Leiden). You can also set the following parameters:
Resolution: A parameter used in the Louvain and Leiden algorithms to control the granularity of the clustering. Higher values of resolution result in more clusters.
Number of neighbors: The number of nearest neighbors to consider when constructing the graph for clustering.
Distance Metric: The distance metric used to calculate the distance between cells. CytoAnalyst supports the following distance metrics:
Euclidean: The standard Euclidean distance.
Cosine: The cosine similarity distance.
Number of Iterations: The maximum number of times the algorithm will run for each random start to optimize the modularity score by refining cluster assignments.
Number of random starts: Sets how many times the clustering algorithm is run from a different random initialization; the run that produces the best clustering result is kept.
K-means Clustering

After selecting the embeddings, enter a name for the clustering and select the clustering method (K-means). You can also set the following parameters:
Number of Clusters for
{embedding}: The predetermined number of distinct groups (k) that the K-means algorithm will partition the data into.Number of random starts: The number of times the K-means algorithm will be run with different initial centroid seeds; the final result will be from the run that yields the best clustering solution.
Sub-clustering Analysis
To sub-cluster a specific cluster, you must create a new clustering analysis on the embedding of the specific cluster. See Create Embedding to learn how to create a new embedding for a specific cluster.
Existing Clustering
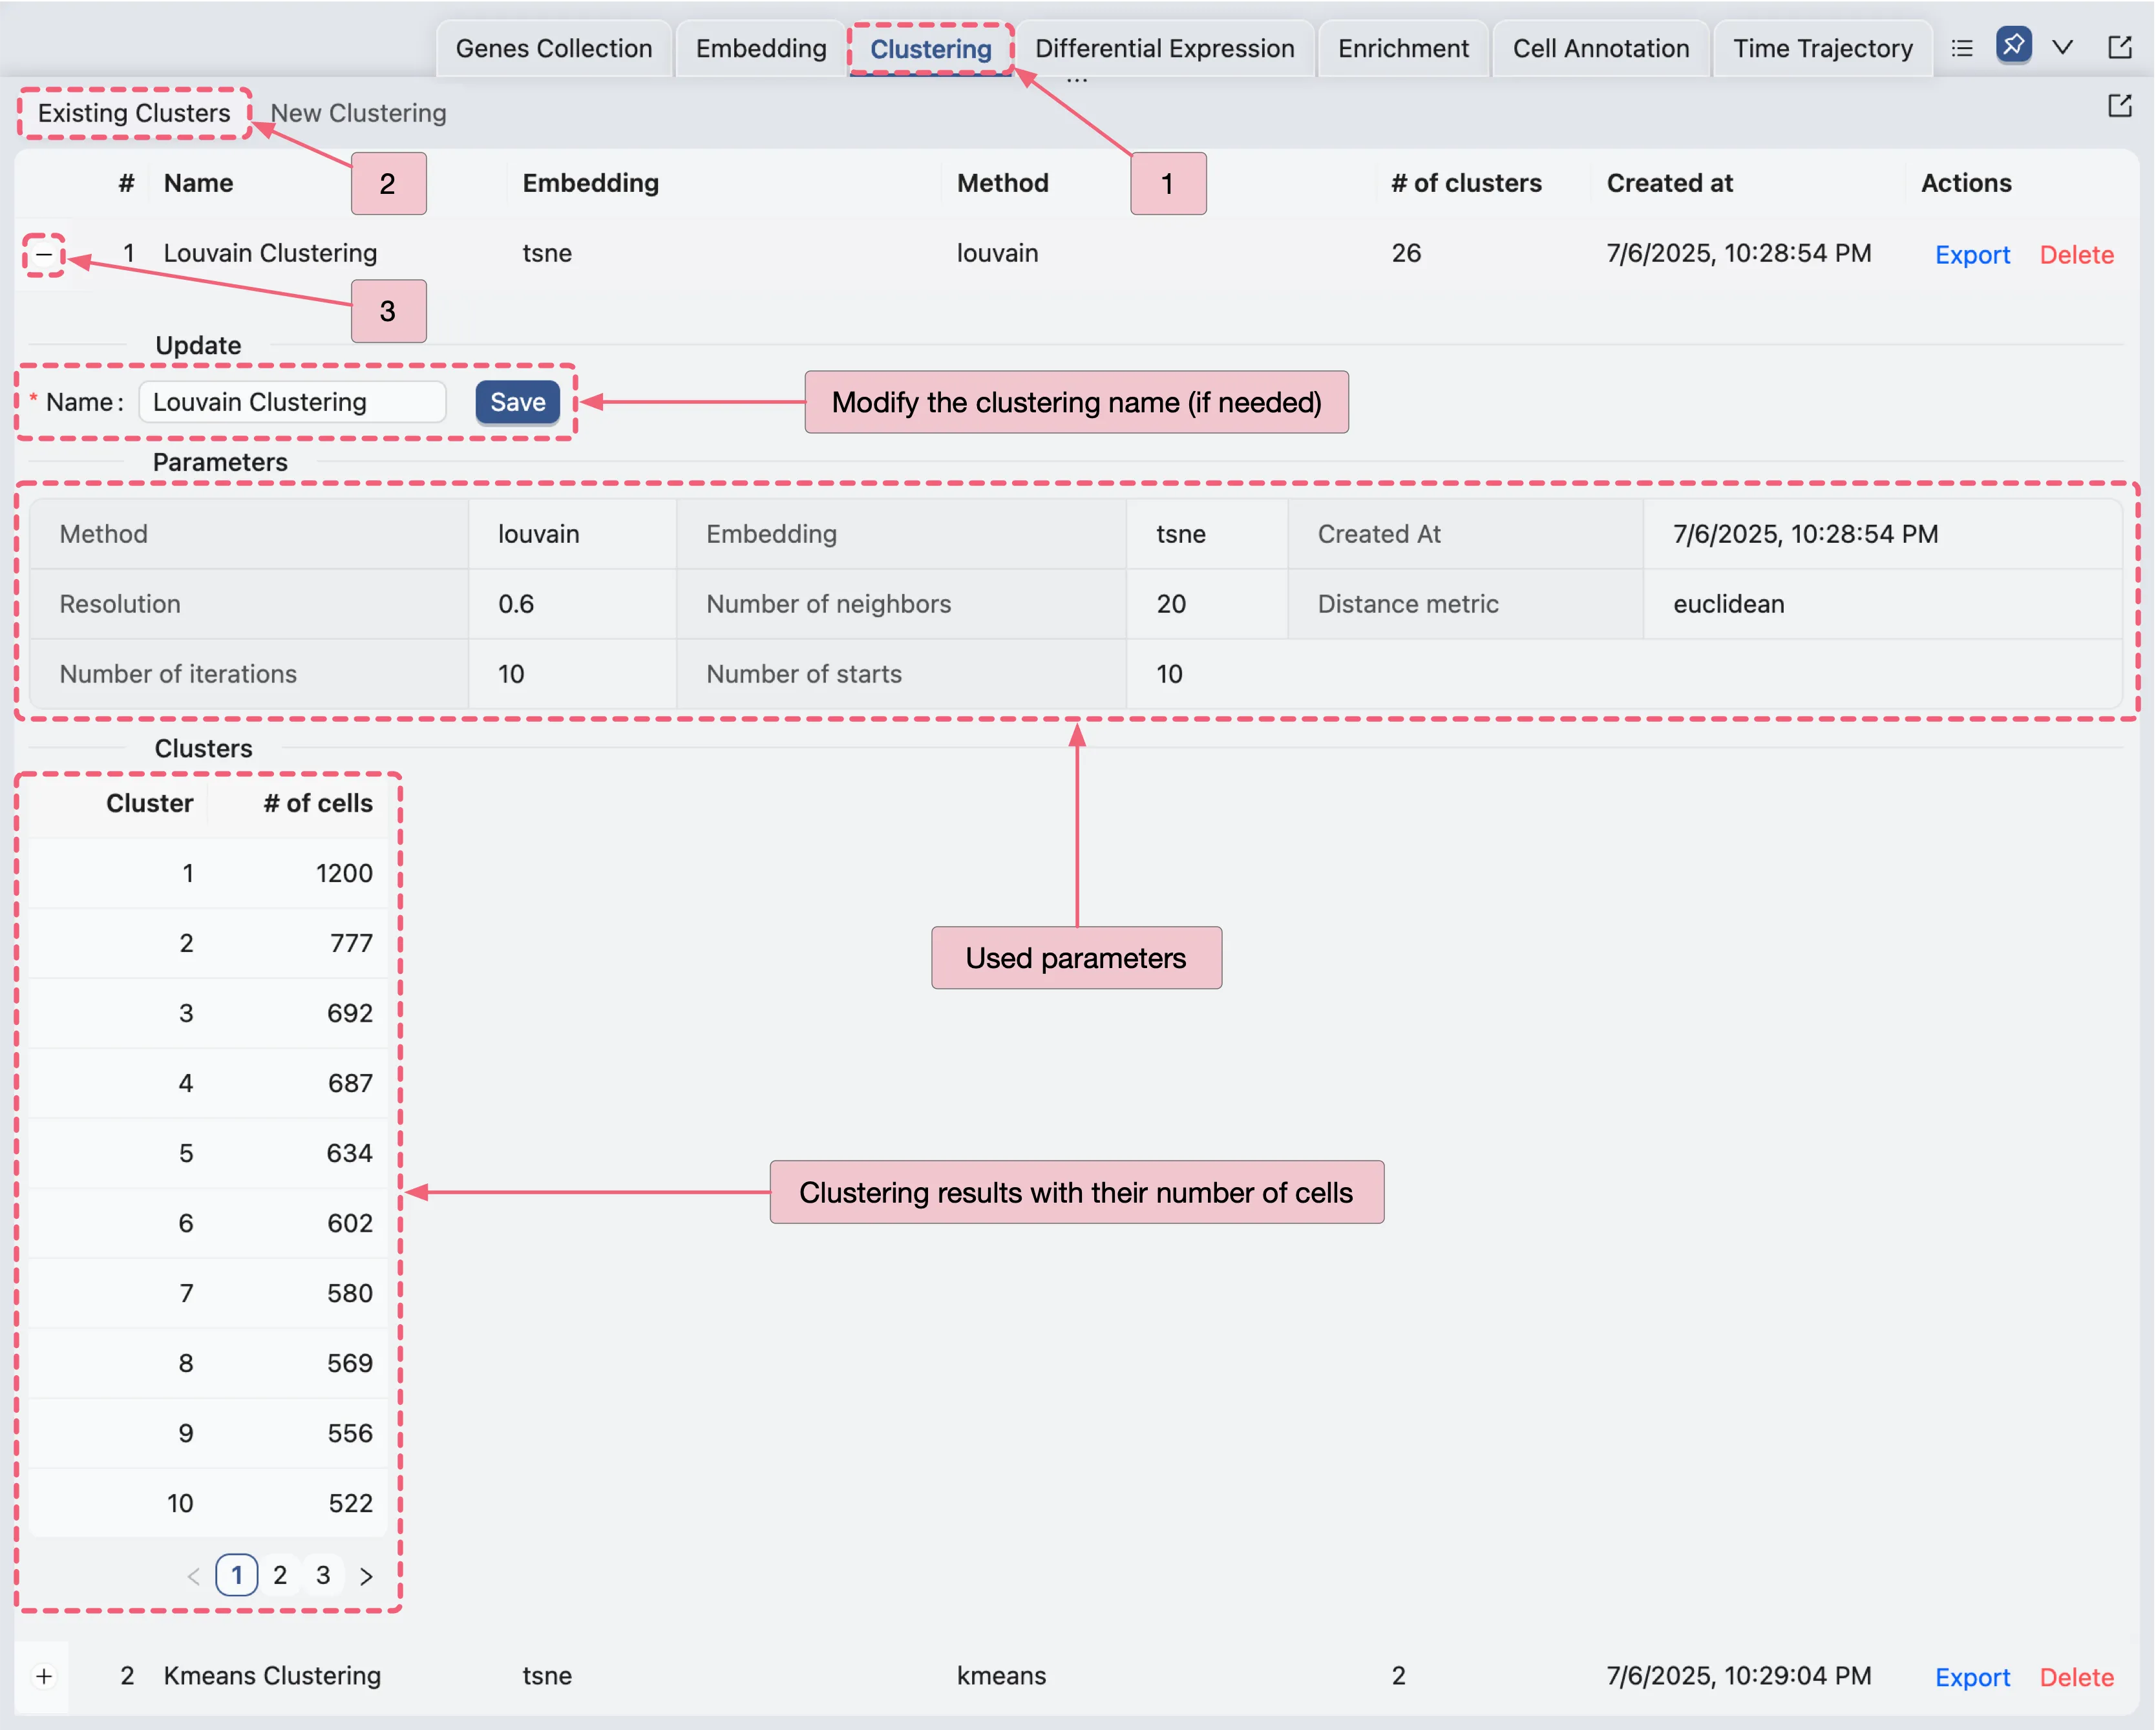
Once you have created a clustering analysis, it will appear in the existing clustering table. To access the existing clustering table, follow these steps:
Click on the
Clusteringtab on the bottom drawer.Click on the
Existing Clusterstab.
On the existing clustering table, you can see all the clustering analyses you have performed. To view the details of a specific clustering analysis, click the ![]() icon next to the clustering name to expand it.
icon next to the clustering name to expand it.
On the expanded view, you can see the following details:
Name: The name of the clustering analysis (you can modify the name by clicking on it and pressing
Saveto save the changes).Parameters: The parameters used for the clustering analysis.
Clusters: The clusters created by the clustering analysis with the number of cells in each cluster.

Visualize Clustering Results
See Data Visualization to learn how to visualize clustering results.