Data Management
This page describes the data management features in the Data Upload page.
Navigation
To access the Data Upload page of a study, click on the View button of the study in the Study Management page.

Page Layout
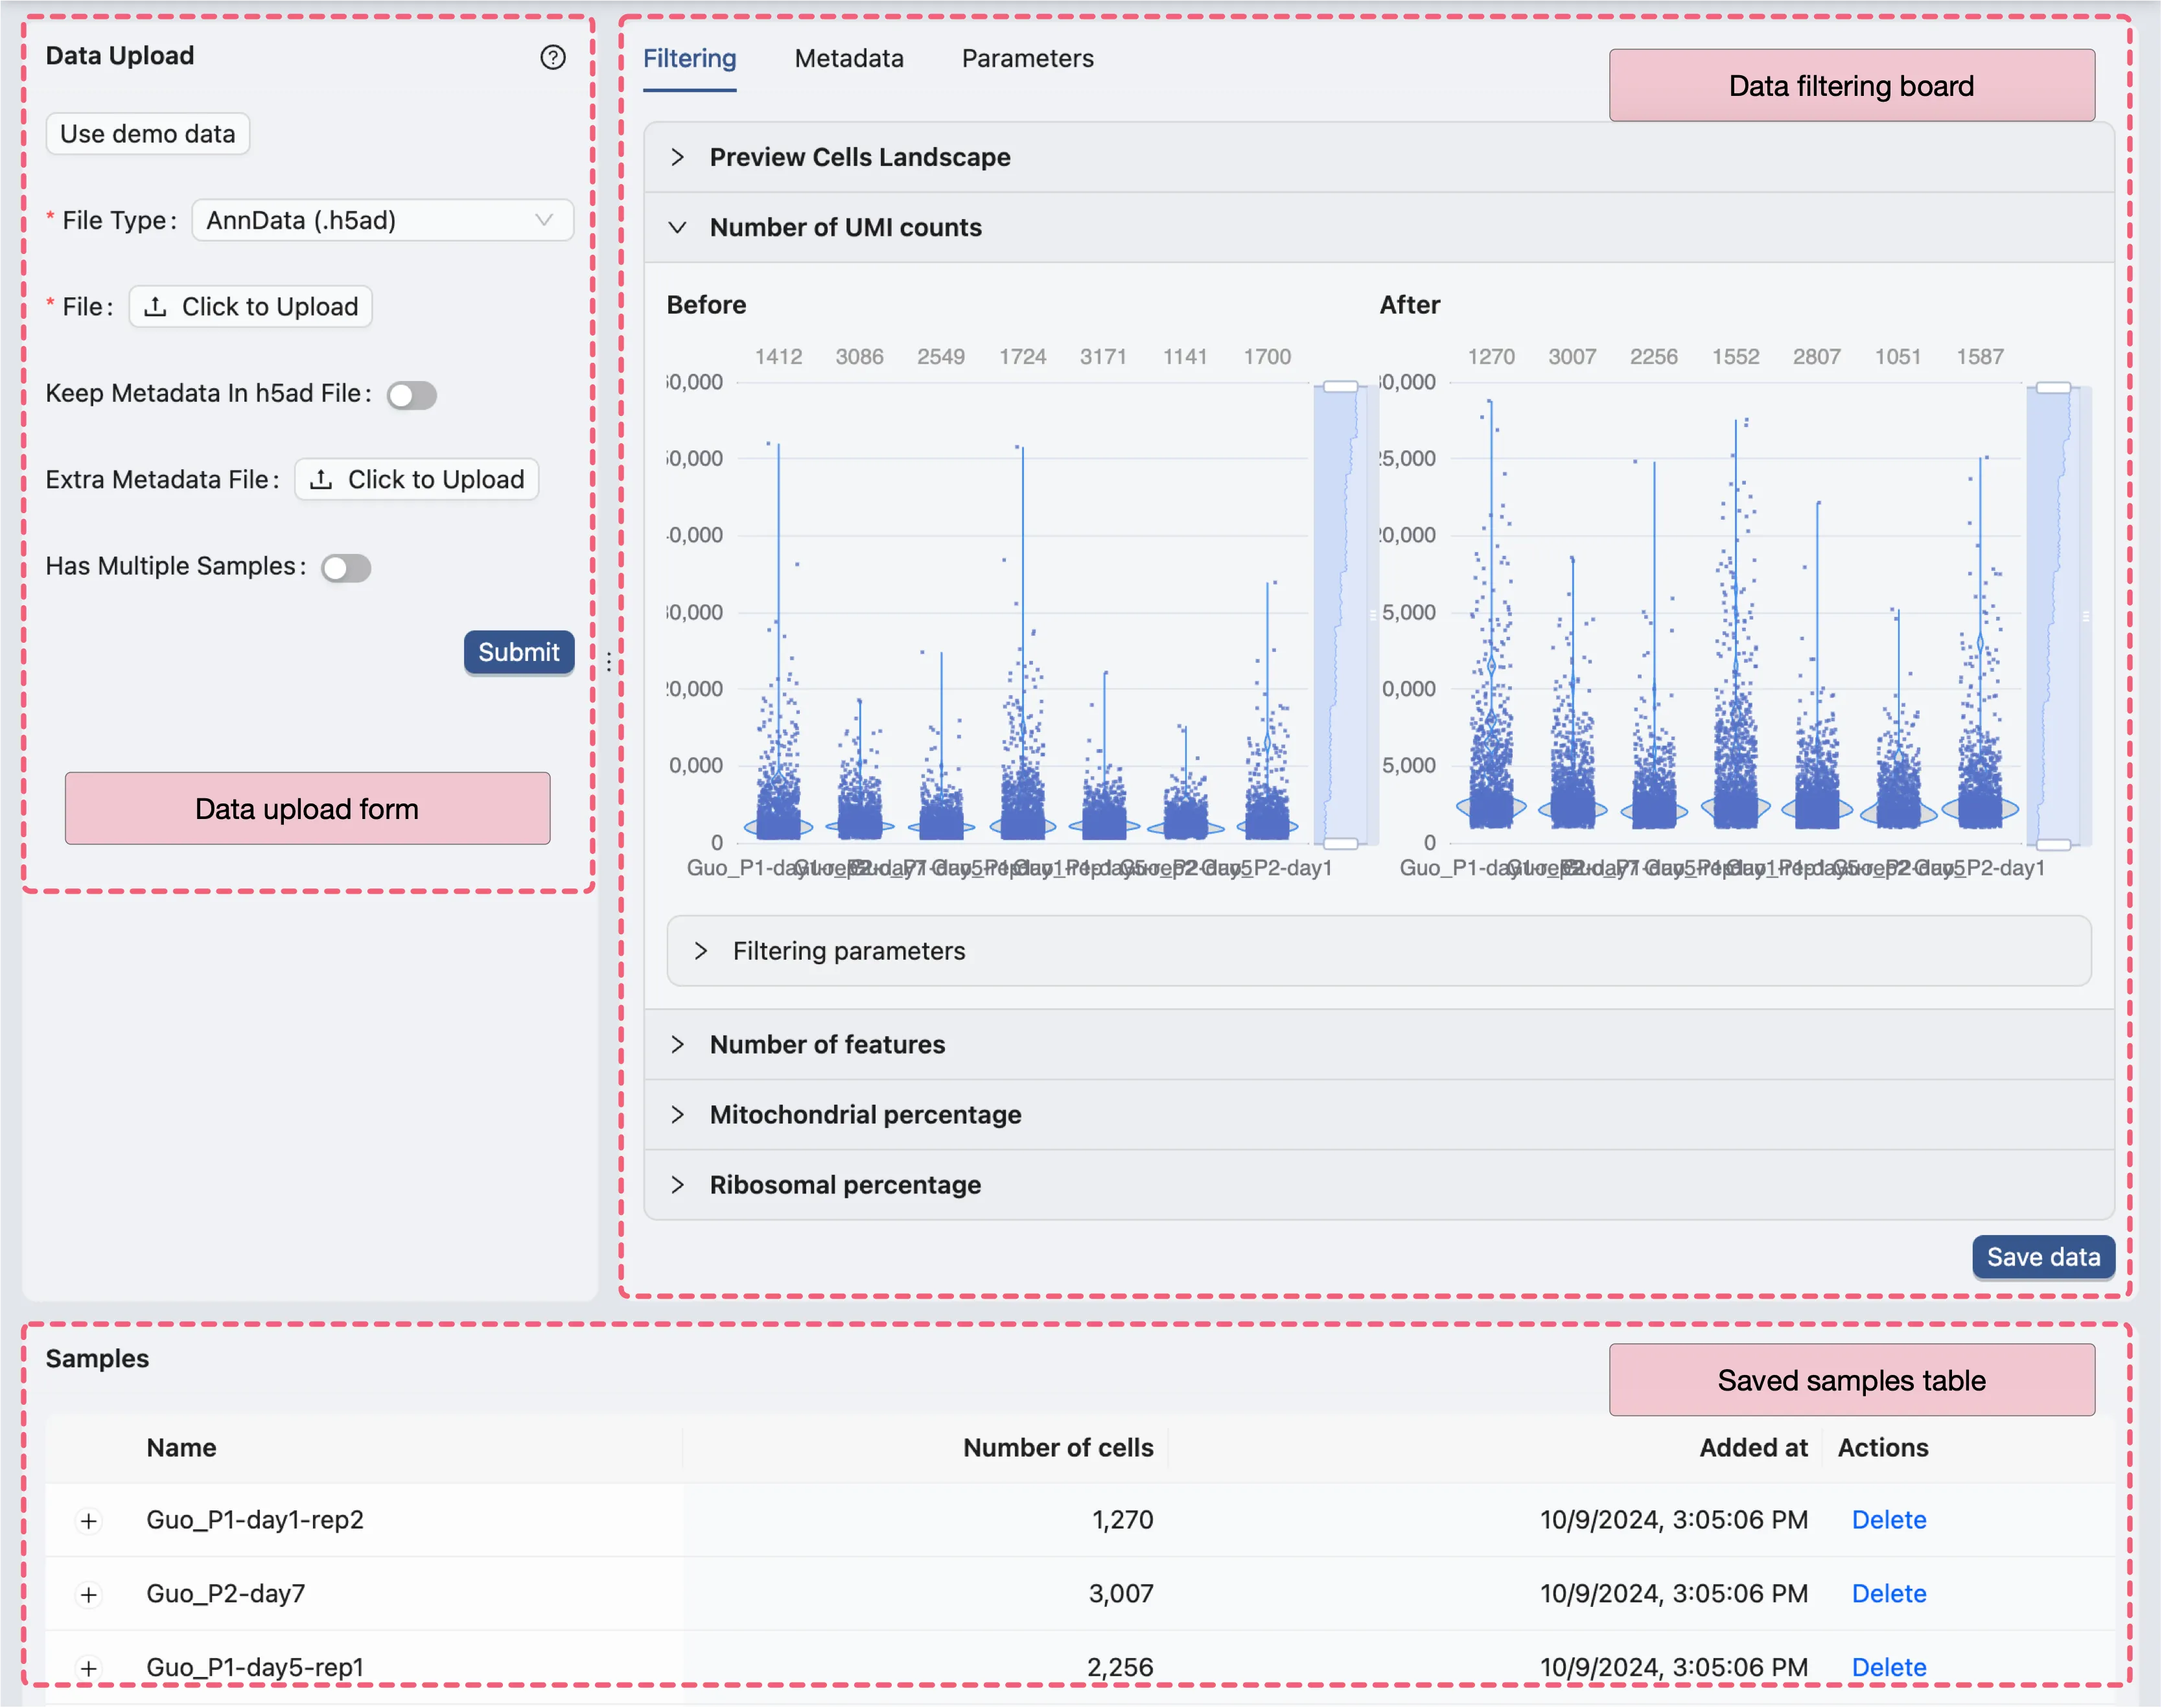
The Data Upload page consists of the following components:
Data Upload Form: The form to upload data files and select processing options.Data Filtering: The panel to preview the data and filter cells based on different criteria.Samples Table: A table to display all samples uploaded in the study.
Workflow
Data Upload Form
![]()
Depending on the data type, the data upload form will have different fields. The items in the data upload form are as follows:
File Type: Select the file type of the data to be uploaded. The options are:AnnData: Annotated data file inh5adformat. The file must contain the following:X: Data matrix orraw/Xfor raw dataobs: Observation metadatavar: Variable metadataSee AnnData documentation for more details.
10x Genomics: Data from 10x Genomics inh5ortar.gzformat.This option is for 10x Genomics data that has been processed using the Cell Ranger pipeline.
If the data is in
tar.gzformat, the file must contain the following:matrix.mtx: Data matrixbarcodes.tsv: Cell barcodesfeatures.tsv: Gene features
File: Upload the data file by clicking theClick to uploadbutton. Once the file is selected, the form will display the file name, size, and available options for data processing.Assay: If the data file contains multiple assays, select the assay to be used for analysis.Feature ID Column: Select the column containing the feature IDs (e.g., gene names).Keep Embeddings: If the data file contains precomputed embeddings, enable this option to keep them.Embeddings: Select the embeddings you want to keep. This option is available ifKeep Embeddingsis enabled.Keep Metadata in h5ad file: If the data file contains metadata, enable this option to keep it in theh5adfile. This option is available forAnnDatafiles.Extra Metadata File: Upload an additional metadata file to be imported with the data. The file selected must have the same number of cells in the data file.Cells ID Column in Metadata: Select the column containing the cell IDs in the metadata file.Has Multiple Samples: Enable this option if the data file contains multiple samples.Sample ID Is In: Select where the sample ID is located in the data file. The options are:Cell ID: The sample ID is in the cell ID, normally in the formatsampleID_cellID.Metadata: The sample ID is in the metadata file.If the sample is in
Cell ID, the form will ask to provide:Sample ID Delimiter: The delimiter used to separate the sample ID from the cell ID.Sample ID Position: The position of the sample ID in the cell ID.For example, if the cell ID is in the format
sampleID_cellID, the delimiter is_, and the position is1. If the cell ID is in the formatcellID_sampleID, the delimiter is_, and the position is2.
If the sample is in
Metadata, the form will ask to provide:Sample ID Column: Select the column containing the sample IDs in the metadata file.
Submit: Click theSubmitbutton to upload the data file and proceed to the next step.
Once the data file is uploaded, a job will be created to process the data. The progress and the logs of the job will be displayed in the Study Logs. To access the study logs, click the Open Study Logs button in the top right corner of the page.
Once the data processing is complete, the filtering options will be displayed in the Data Filtering panel.
Data Filtering
The Data Filtering panel allows you preview the data and filter the data based on different criteria, including:
Number of UMI counts: Filter cells based on the total number of UMI counts.Number of features: Filter cells based on the number of expressed features/genes.Percentage of mitochondrial genes: Filter cells based on the percentage of mitochondrial genes.Percentage of ribosomal genes: Filter cells based on the percentage of ribosomal genes.
Preview Cells Landscape
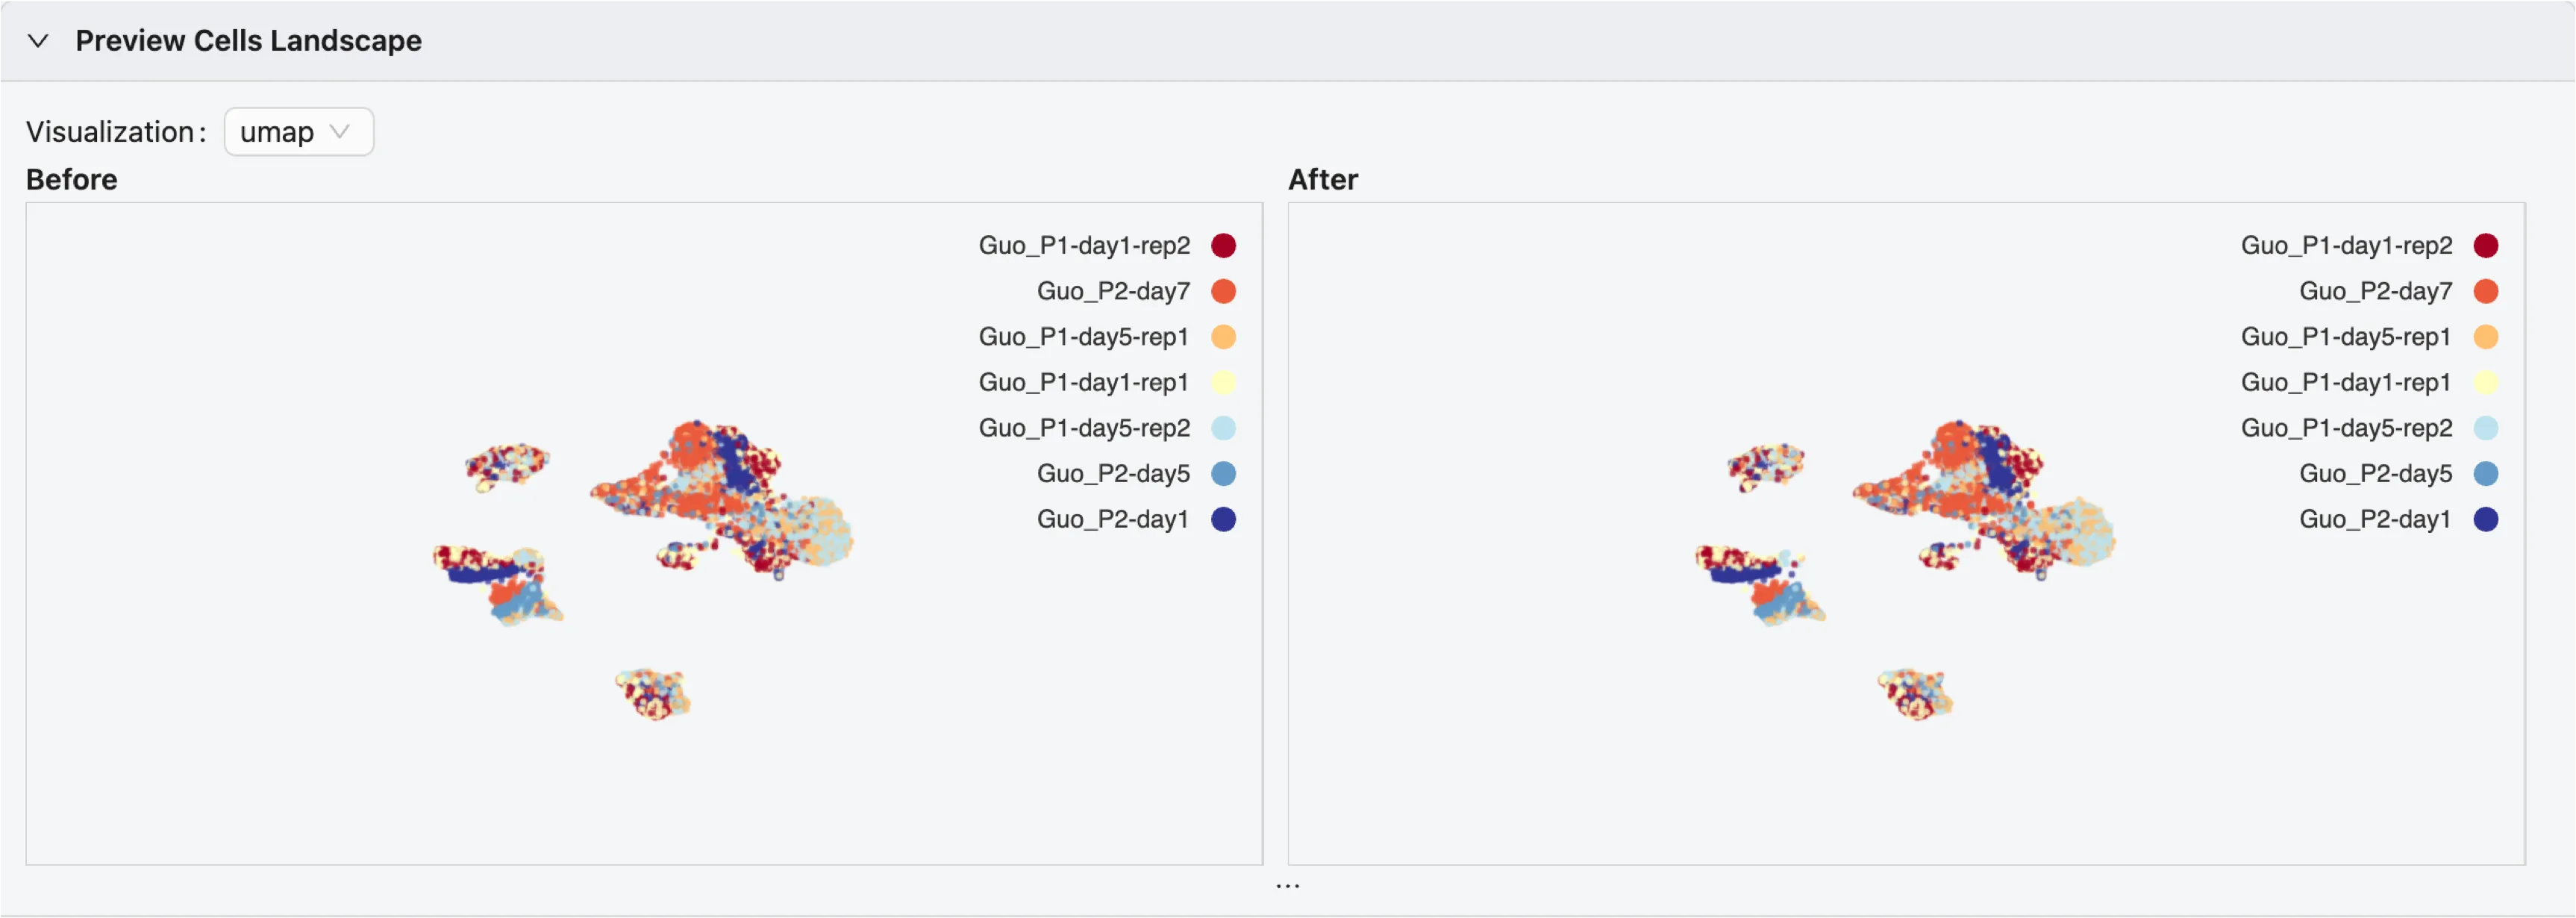
If your data contains precomputed embeddings and you have selected to keep them, the preview will display the cells in the 2D embedding space.
If you have more than one embedding, you can switch between them using the dropdown menu.
If you have more than one sample in the data, each sample will be displayed in a different color.
The plot are interactive and you can zoom in, zoom out, and select samples by clicking on the visual legend.
There are two plots available:
Before Filtering: The cells before applying any filters. See below for more details on how to filter cells.After Filtering: The cells after applying the selected filters.The
After Filteringplot will be updated in real-time as you adjust the filters.
Filter Cells
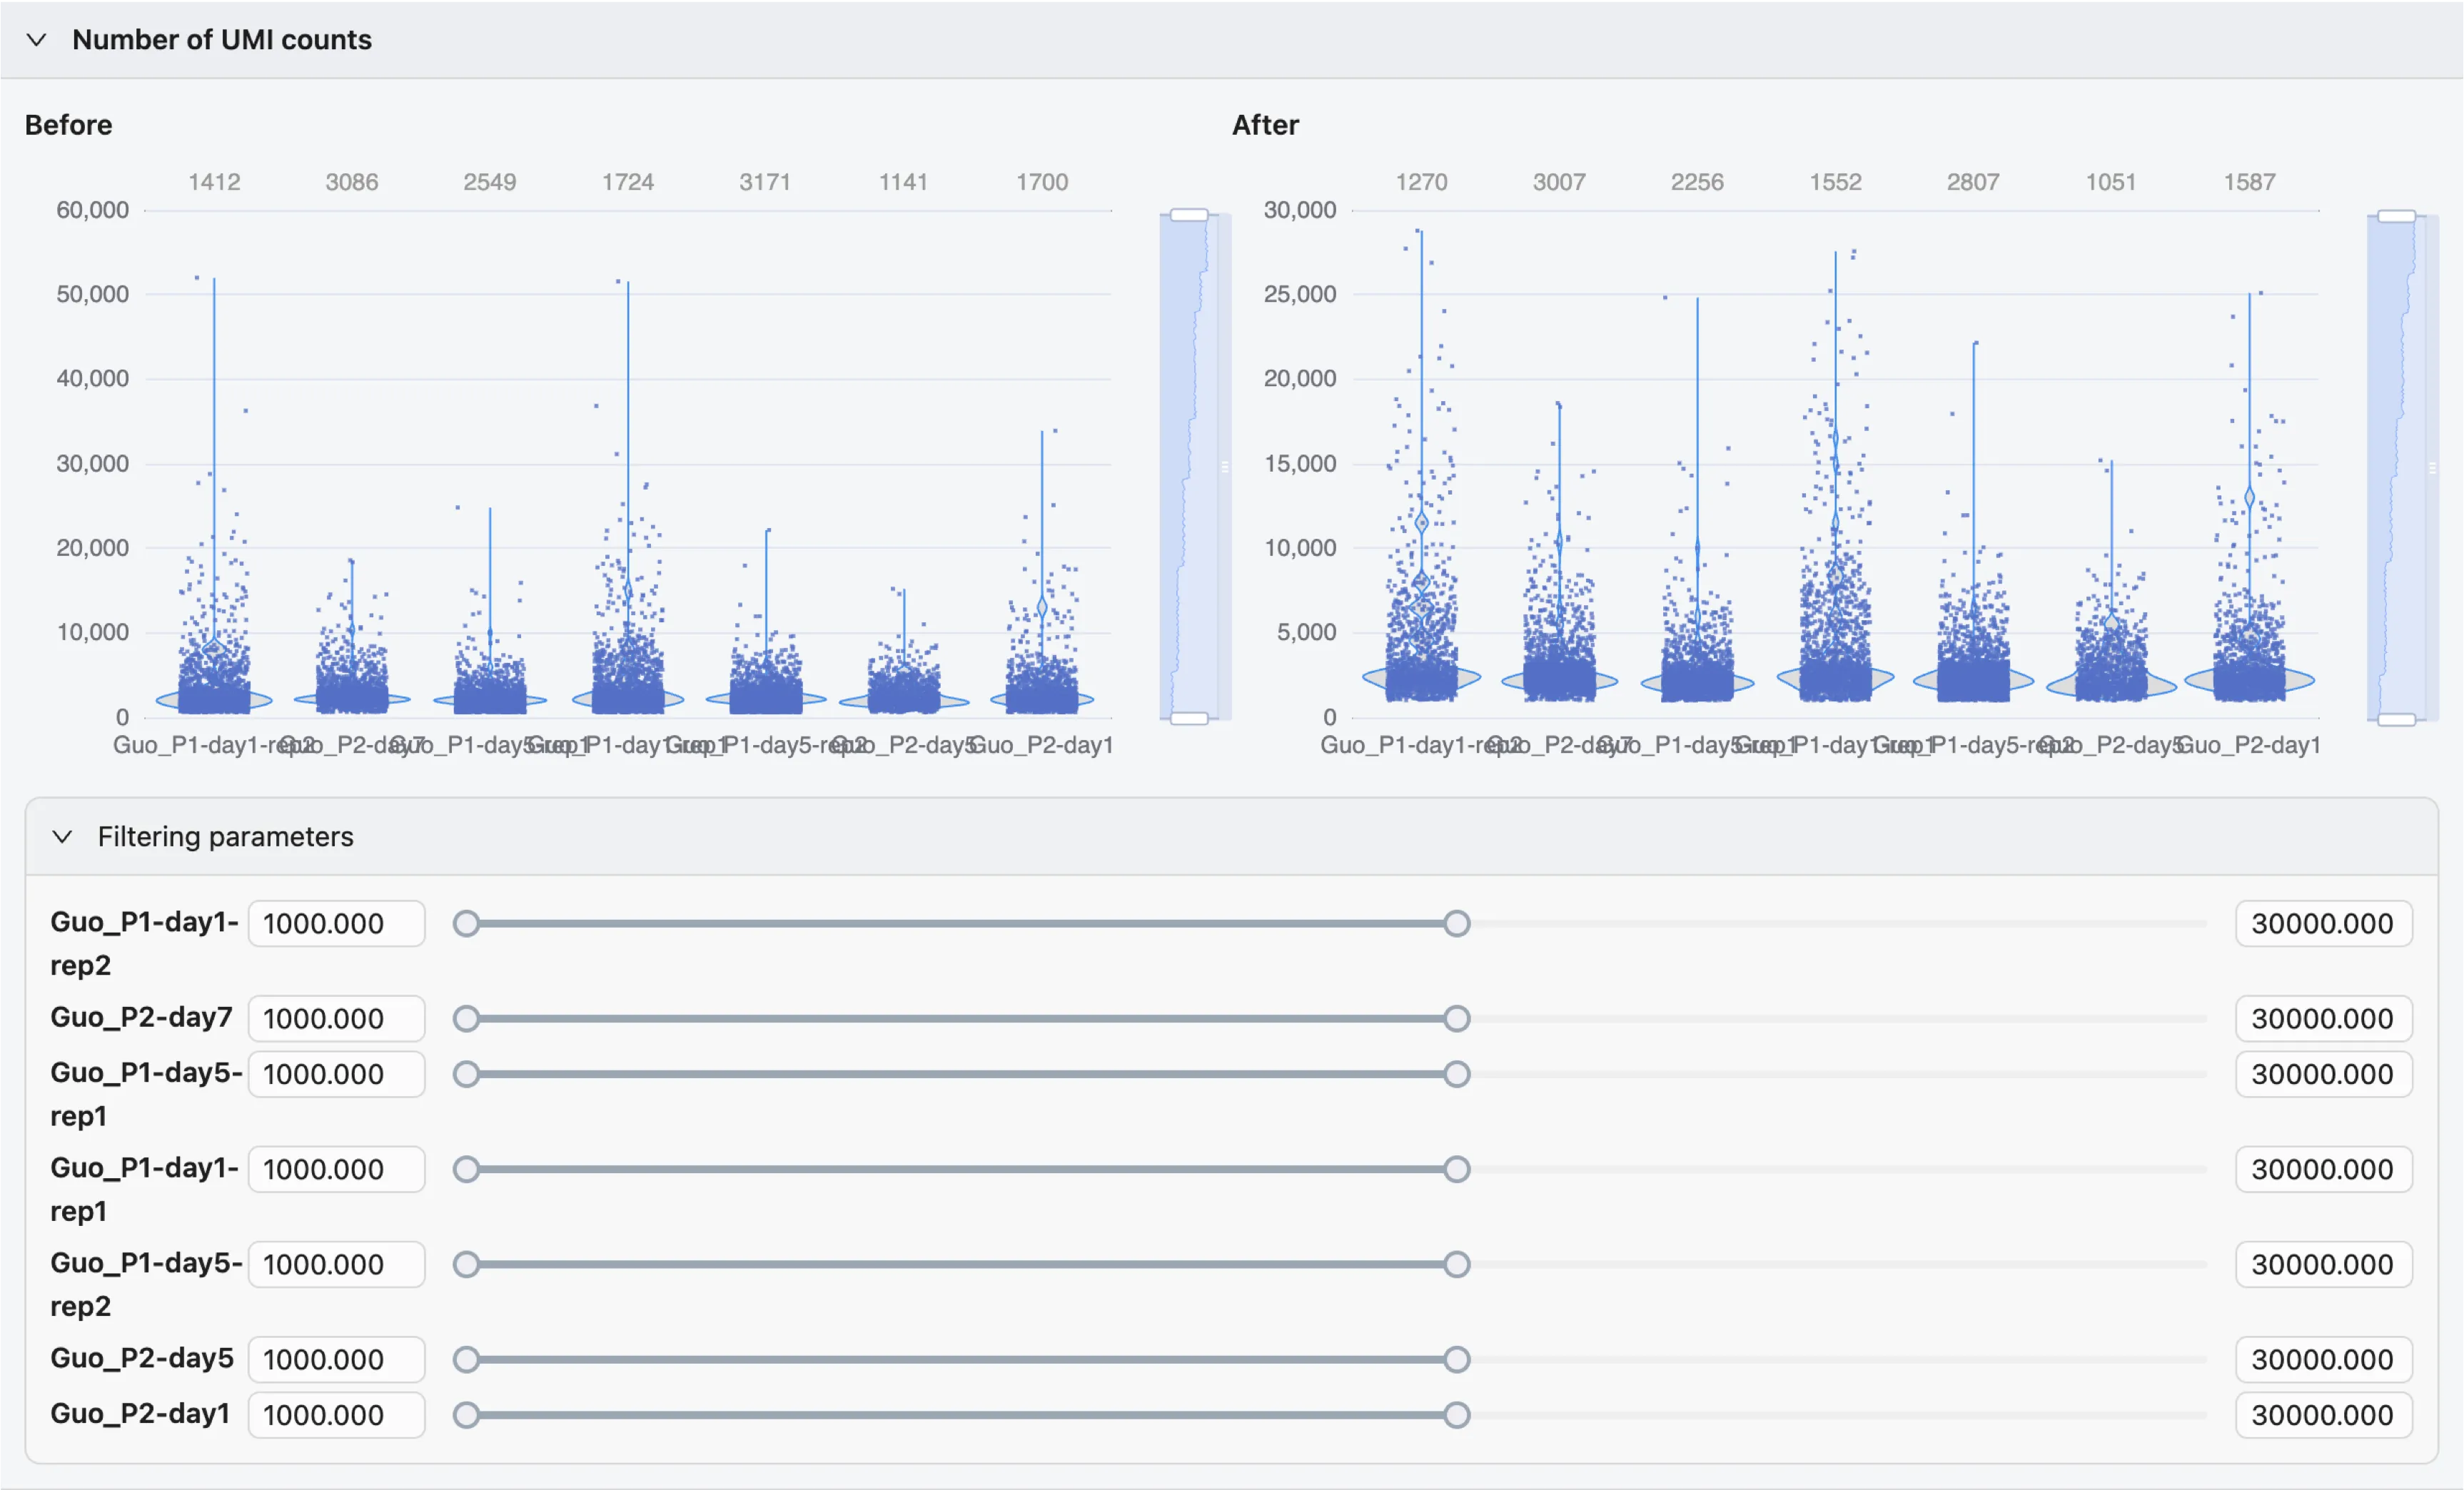
For each filter, there are two violin plots:
Before Filtering: The distribution of the selected metric before applying the filter.After Filtering: The distribution of the selected metric after applying the filter.If you have multiple samples, each sample will be displayed in a different column of the violin plot.
The
After Filteringplot will be updated in real-time as you adjust the filter.The plots are interactive and you can zoom in using the slider on the left side of the plot.
To adjust the filter, move the slider to the desired value, or input the value directly in the input box.
Save Data
Once you are satisfied with the filtering settings, click the Save Data button on the bottom right corner of the Data Filtering panel. A dialog will appear to save the filtered data:
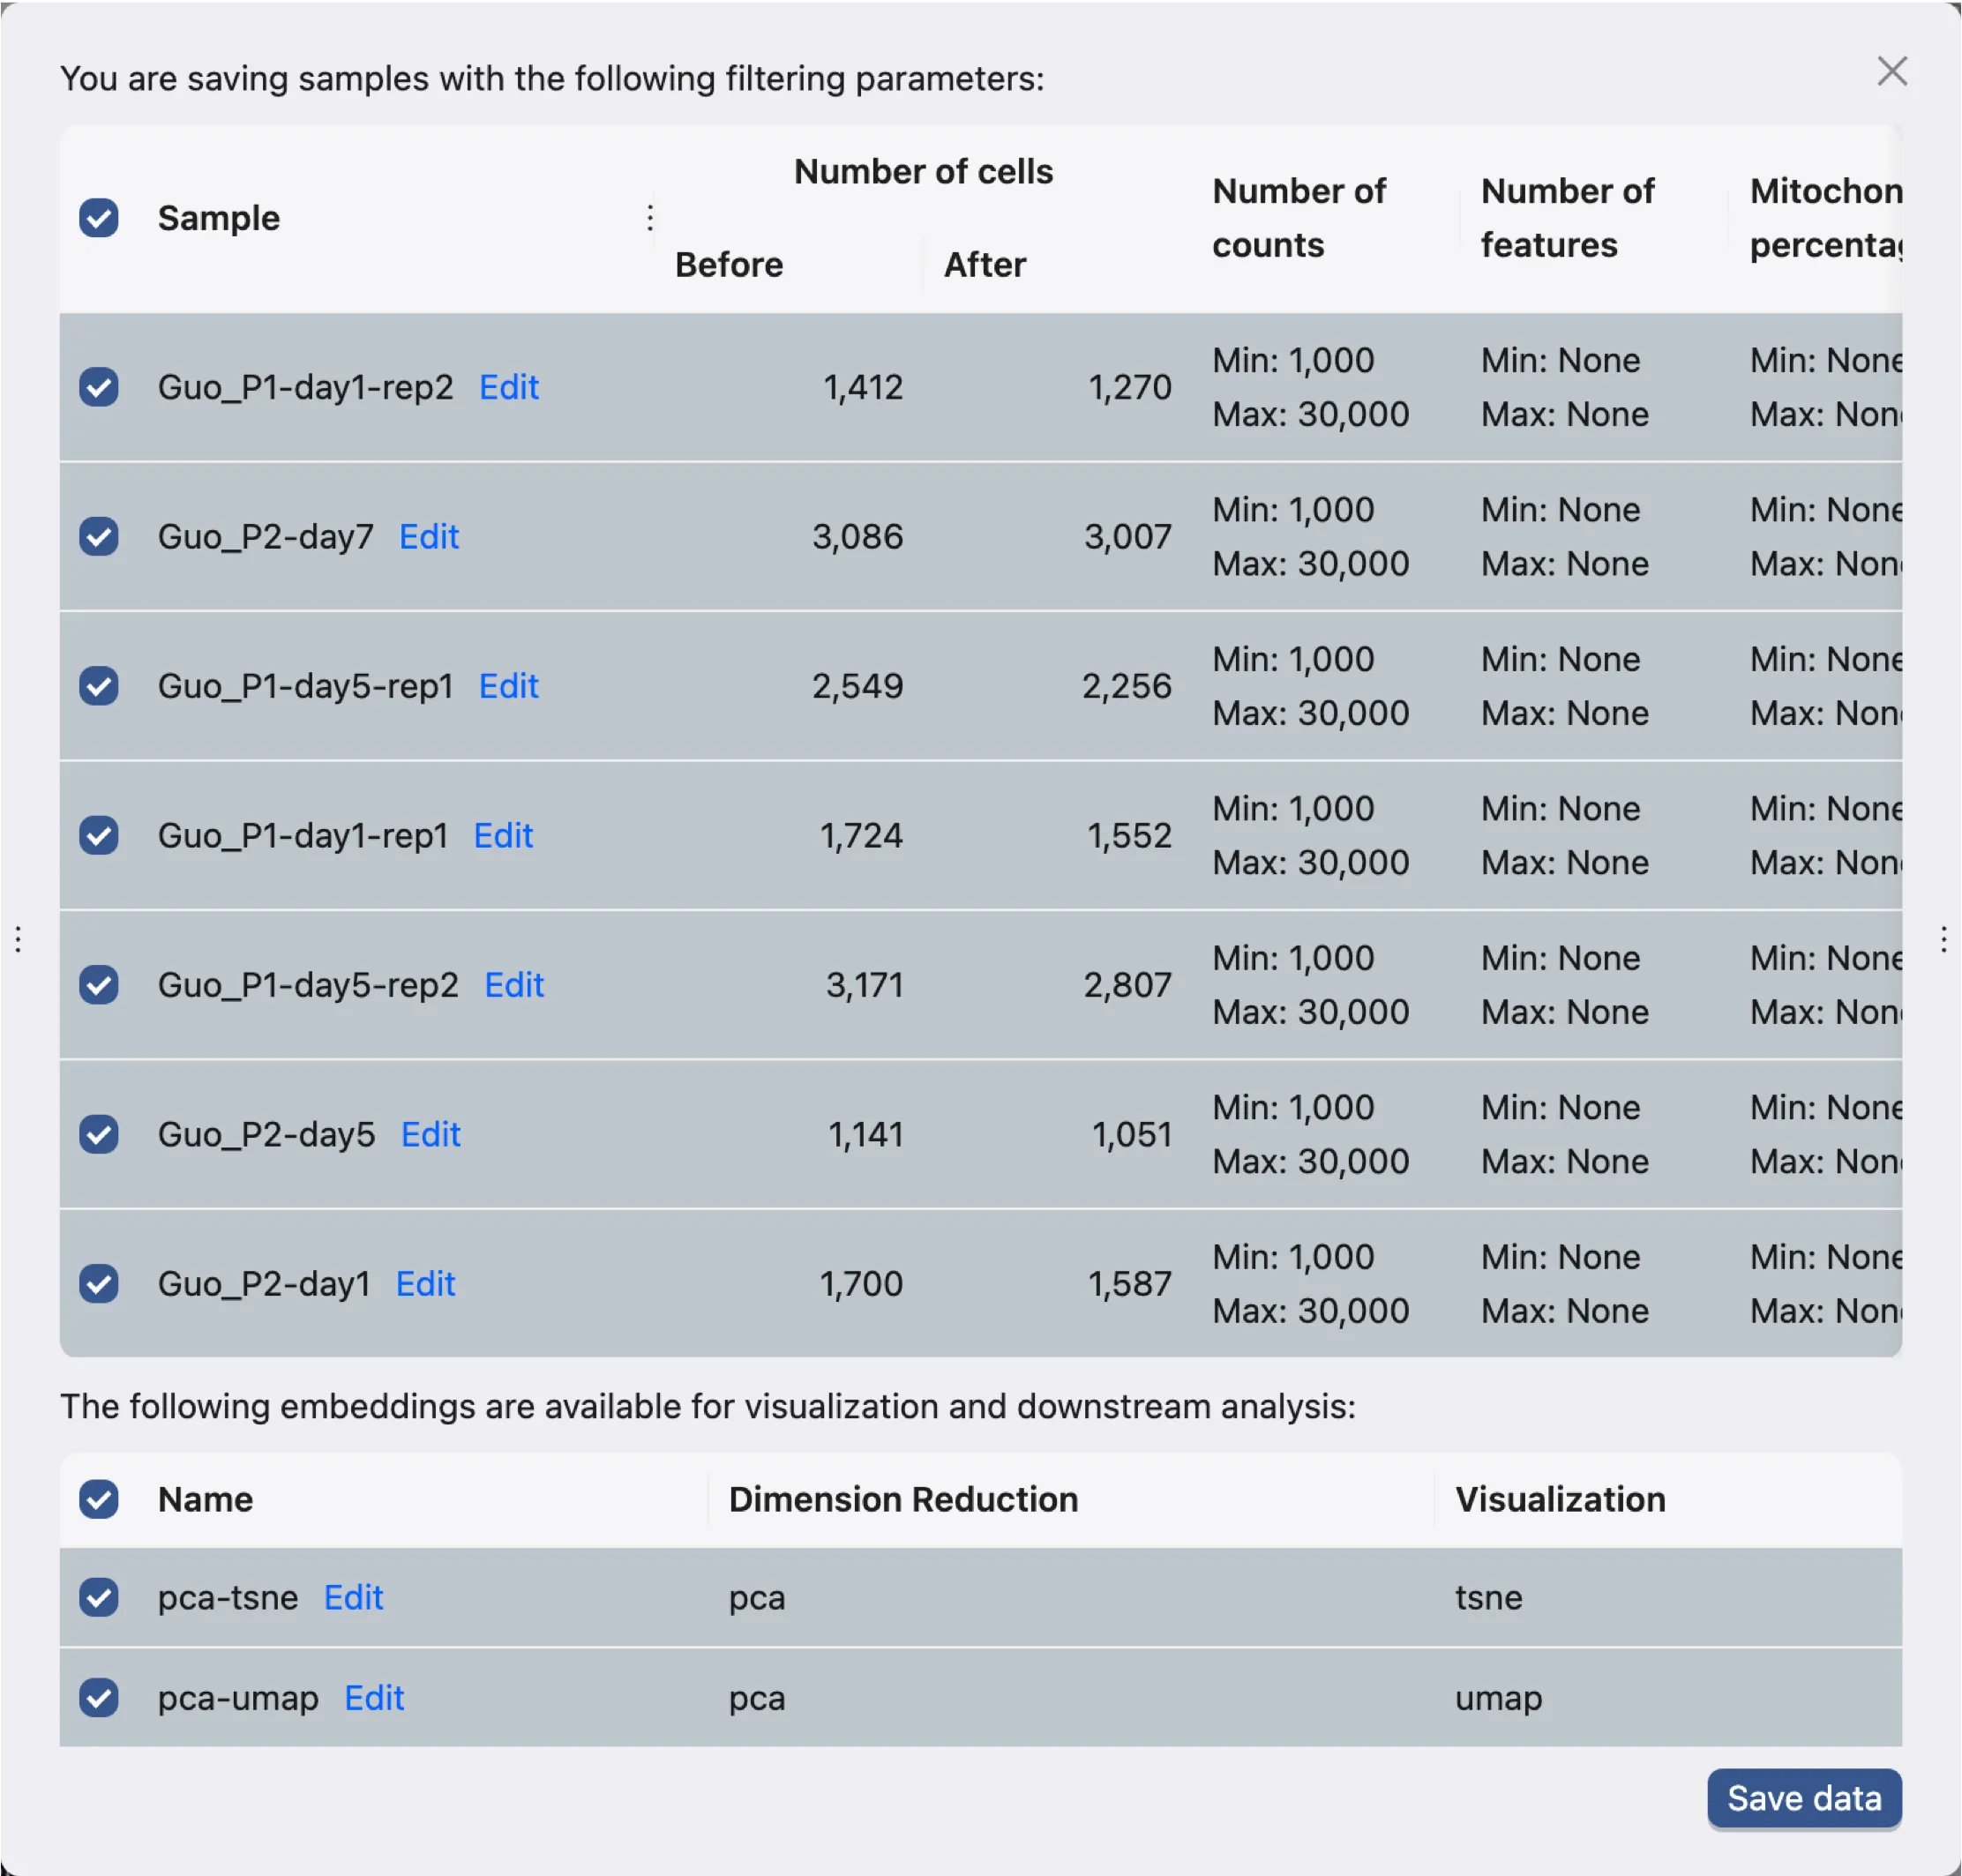
The dialog contains the following:
A table with each sample in each row and:
The number of cells before and after filtering.
The criteria used for filtering.
On this table:
Check the samples you want to save.
Click
Editon the sample name to change the sample name. Sample name can also be change later after saving the data.
A table with each pair of embedding and visualization in each row
Check the pairs you want to save.
Click
Editon the name to change the name of the pair.
Once you have selected the samples and pairs to save, click the Save data button to save the data. This will create a job to save the data and the progress and logs of the job will be displayed in the Study Logs.
Samples Table
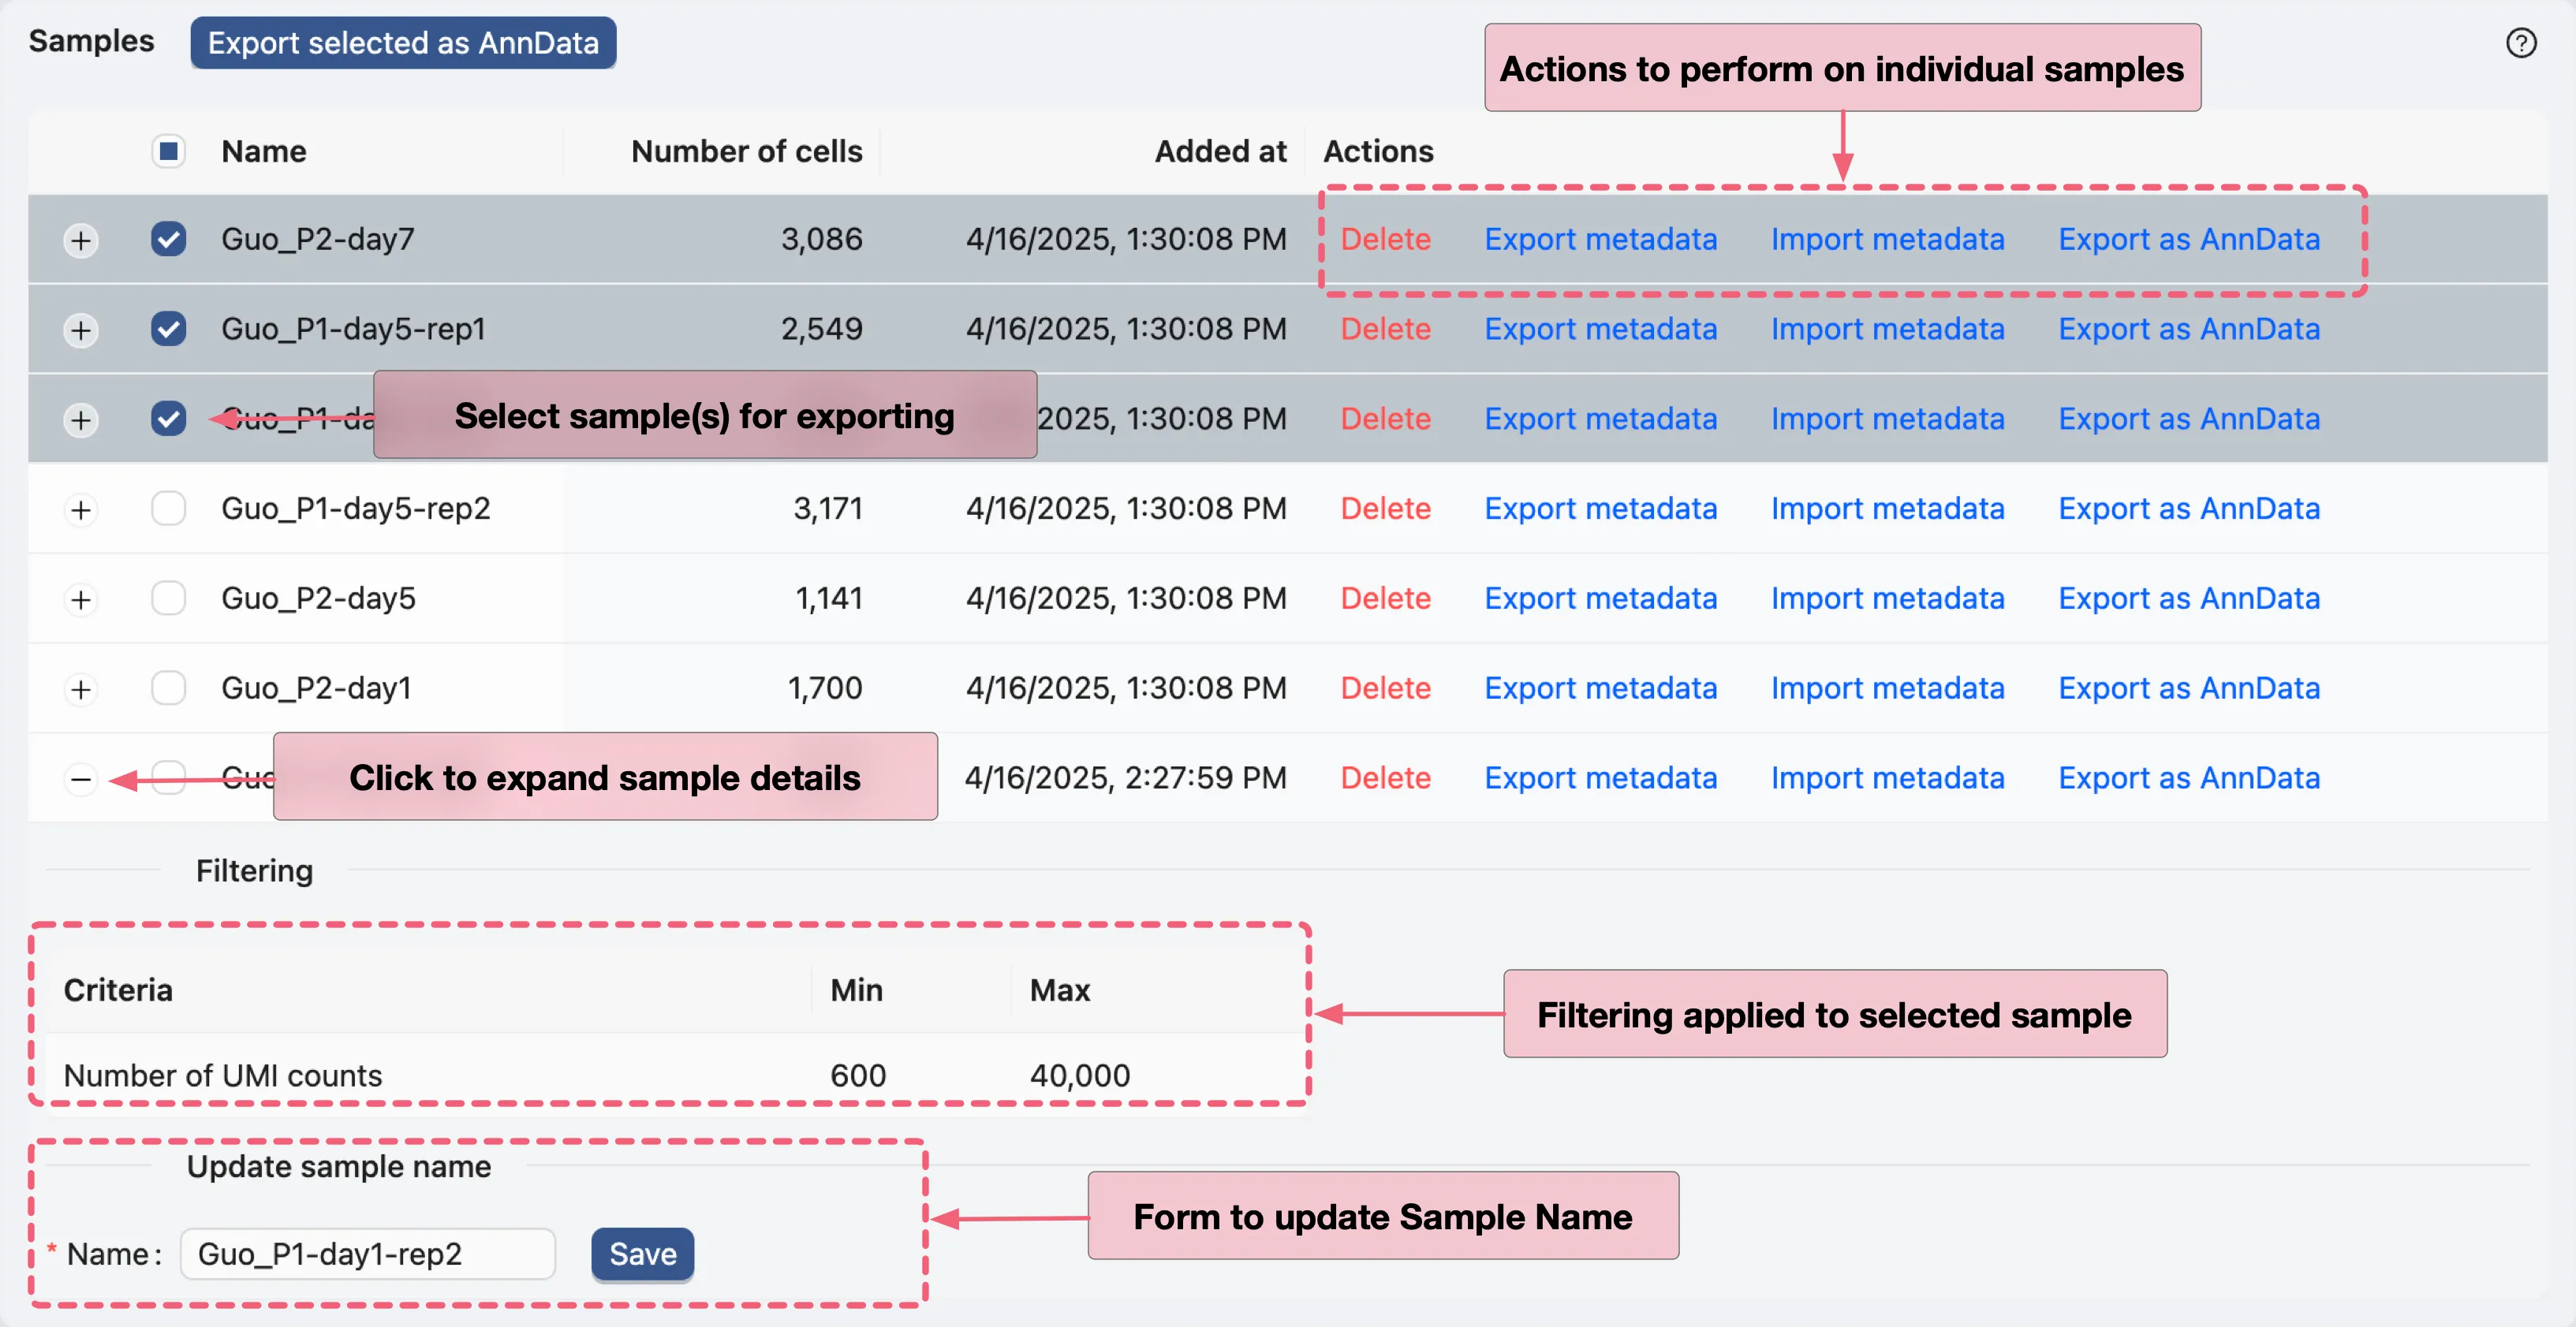
The Samples Table displays all samples uploaded in the study. To see the details of a sample, click the + at the beginning of the row. The details include:
Filtering: The filtering criteria used for the sample.Name Update Form: To update the sample name.
For individual samples, the following actions are available:
Delete: Permanently delete the sample and associated data.Export metadata: Export the metadata of the sample incsvformat.Import metadata: Import a new metadata file for the sample.Export as AnnData: Export the sample as anAnnDatafile.
You can also select multiple samples and export them as AnnData files.
Import Extra Metadata
To import a new metadata file for a sample, click the Import metadata button in the row of the sample. A dialog will appear to upload the metadata file:
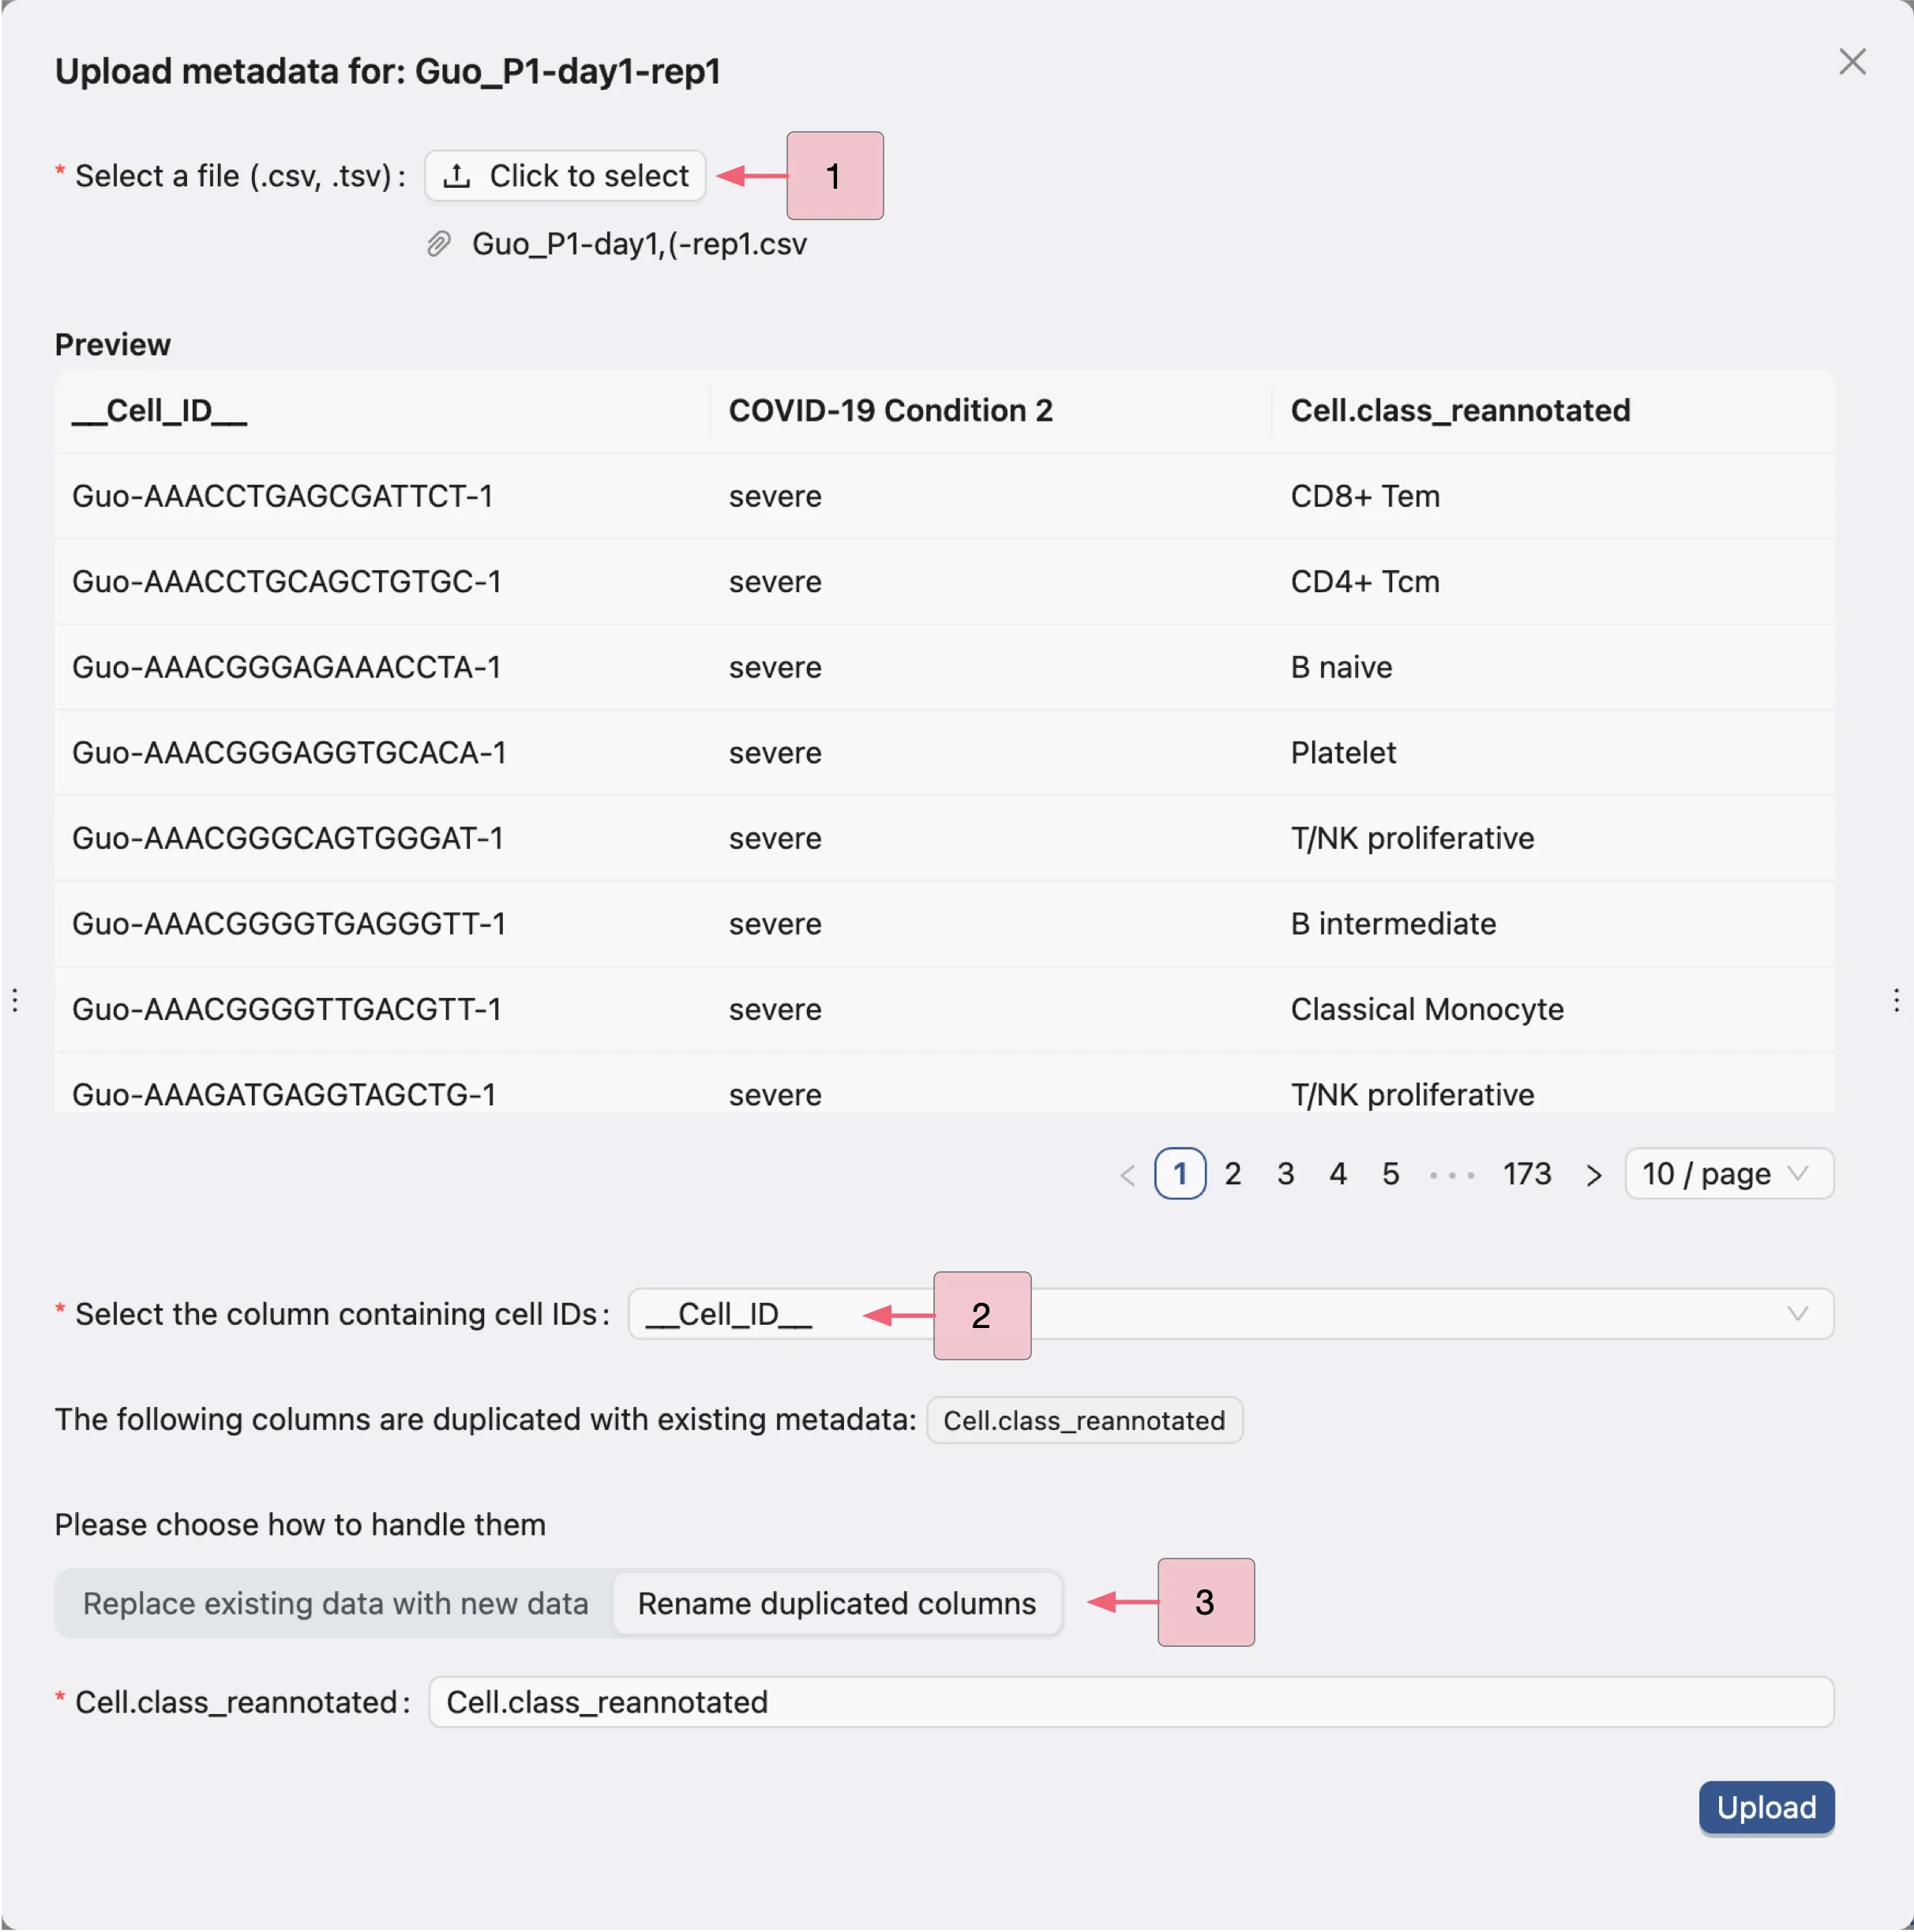
Select the metadata file to upload.
Select the column containing the cell IDs in the metadata file.
In case the metadata file contains columns with the same name as the existing metadata, select whether to:
Replace existing data with new data: Replace the existing metadata with the new metadata.Rename duplicate columns: Rename the columns with the same name in the new metadata.
Finally, click the Upload button to upload the metadata file. This will create a job to upload the metadata and the progress and logs of the job will be displayed in the Study Logs.
Note: The metadata file must have the same number of cells as the data file.
Export Samples As AnnData (.h5ad) File
To export a sample as an AnnData file, click the Export as AnnData button in the row of the sample. Alternatively, you can select multiple samples and click the Export as AnnData button at the top of the table. A dialog will appear to select data to export:
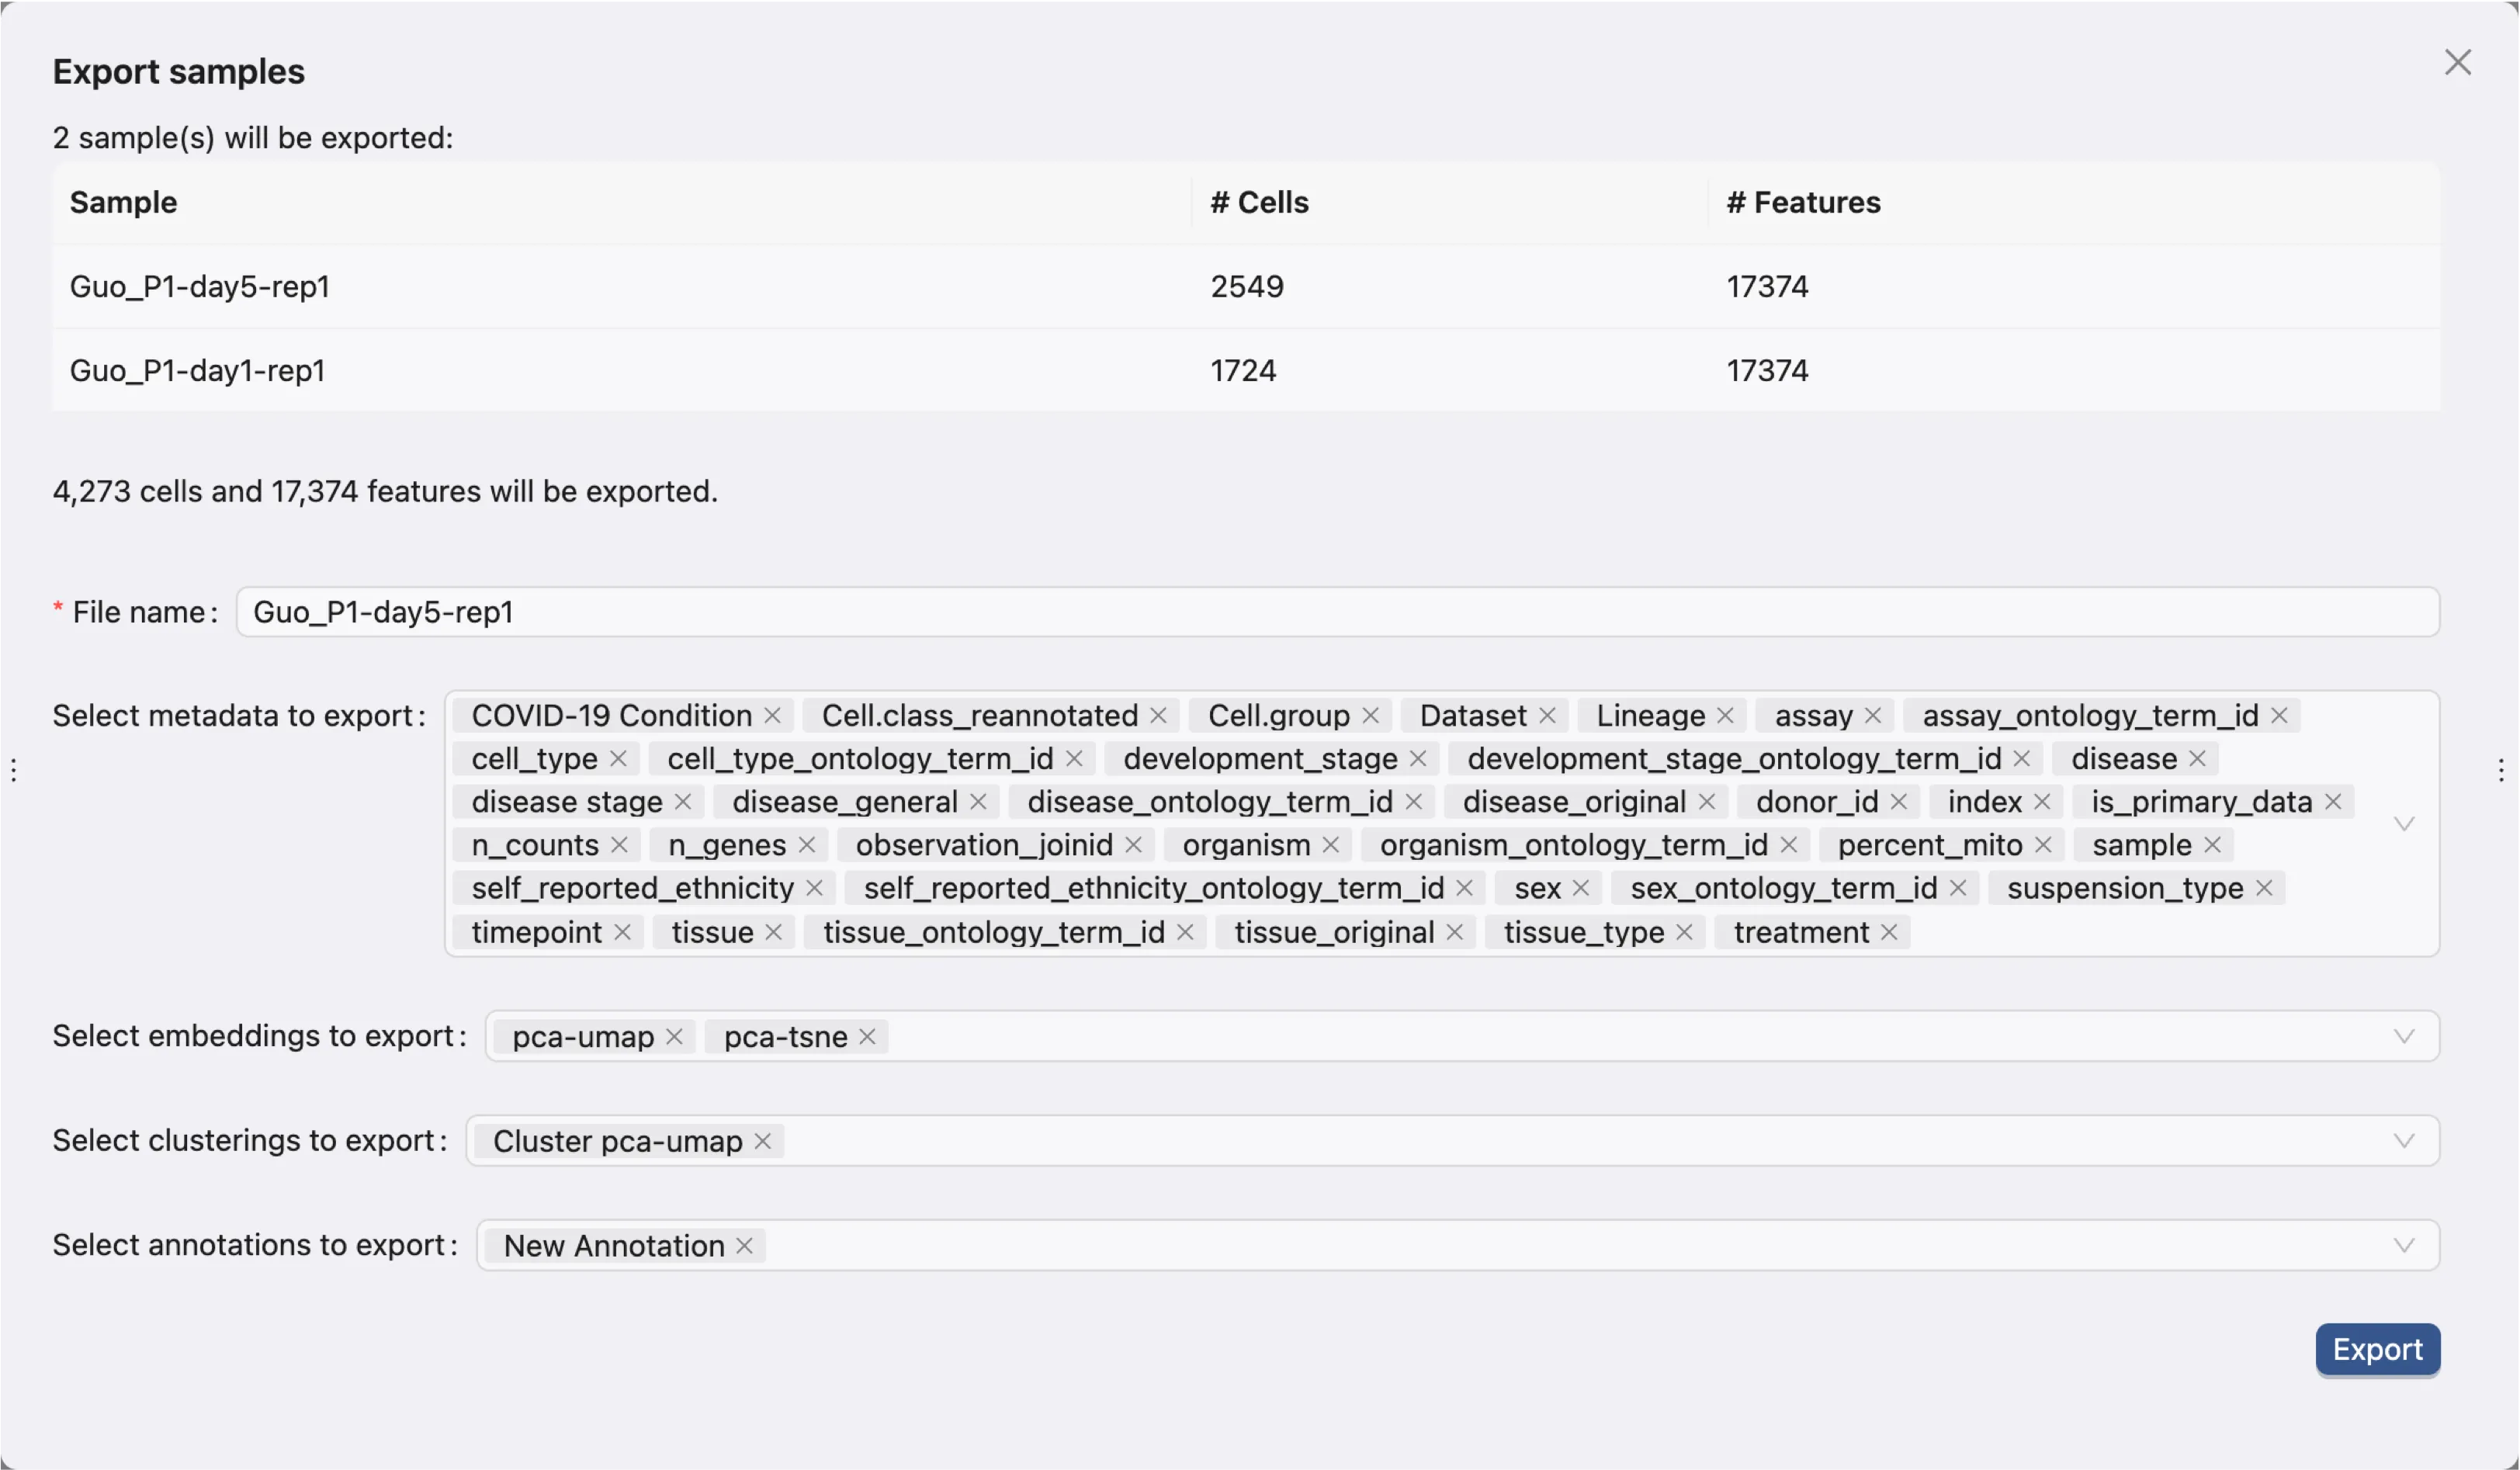
The dialog will ask you to enter a name for the export file and select metadata, embeddings, clustering results, and annotations to include in the export.